Creating a Site Suitability Map for Hazelnut (GIS, Layers, Weights, Scoring)
Content generated by artificial intelligence — verify before application
This article was automatically compiled from a collection of hazelnut literature with the help of artificial intelligence and may contain errors or outdated data. It serves as a starting point for further research, not as professional advice. Dosages, products, and timing are informative and depend on the cultivar, location, and current regulations — always verify with an advisory service and official sources before application.
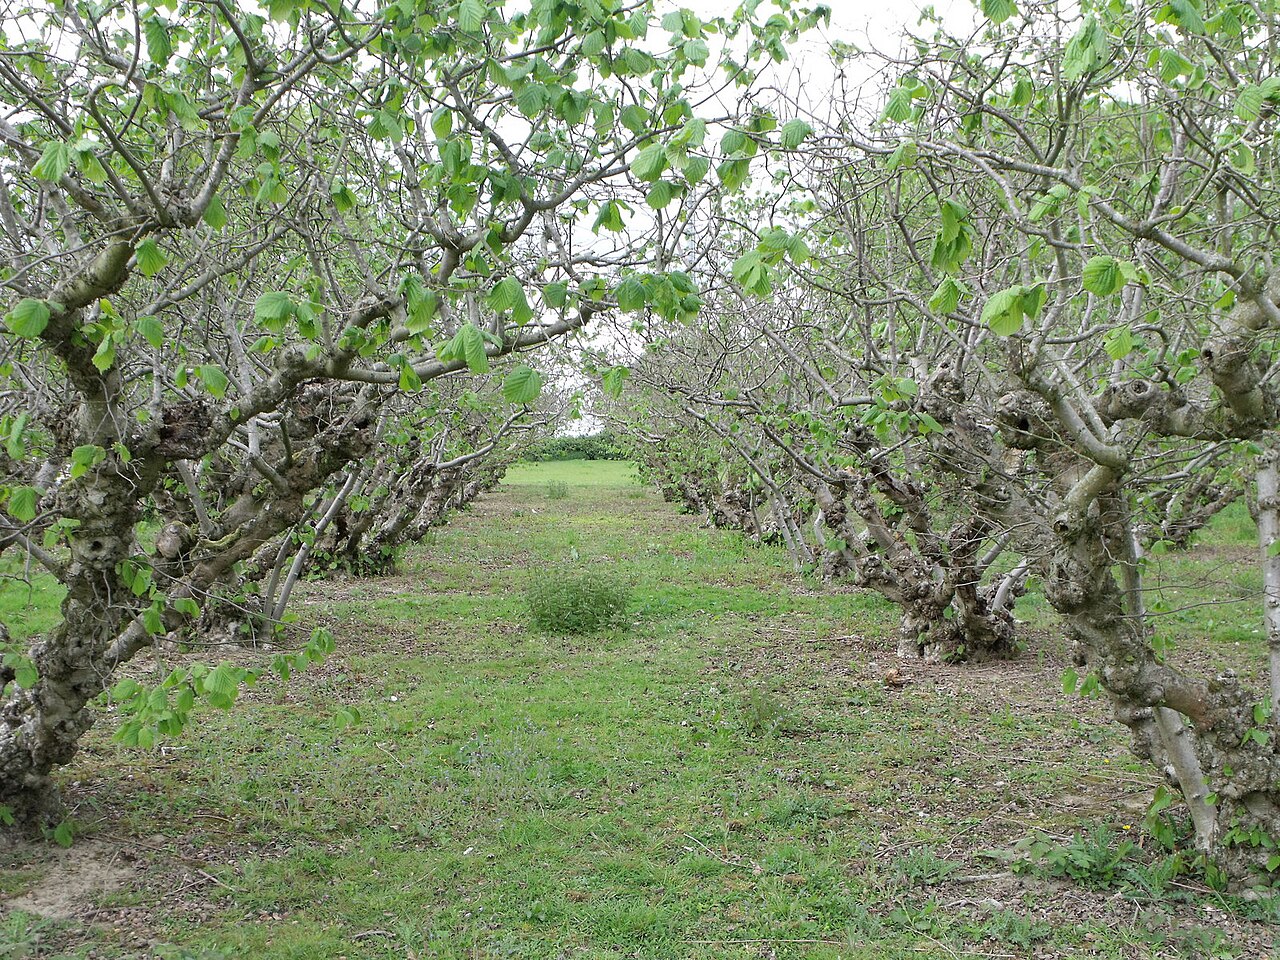
The decision on where to establish a hazelnut orchard is the most important and enduring decision a producer makes — the orchard remains in the same location for 30 years or more, and a mistake in site selection cannot be corrected later by fertilization or pruning. Instead of relying on impressions ("the terrain is nice, gently sloping"), this guide shows you how to systematically, step by step, create a suitability map for hazelnut in a free GIS program and how to compare multiple parcels by number. The method is called multi-criteria land suitability analysis and is routinely applied in scientific literature specifically for hazelnut and other fruit species.
What is a suitability map and why GIS
A suitability map is a thematic map where each part of the terrain is colored according to how well it suits hazelnut cultivation — from "very suitable" to "unsuitable." It is created by overlaying several thematic layers (climate, soil, slope, aspect, water, frost risk), assigning a weight to each layer based on its importance, and calculating a suitability score for each point in the terrain from their sum.
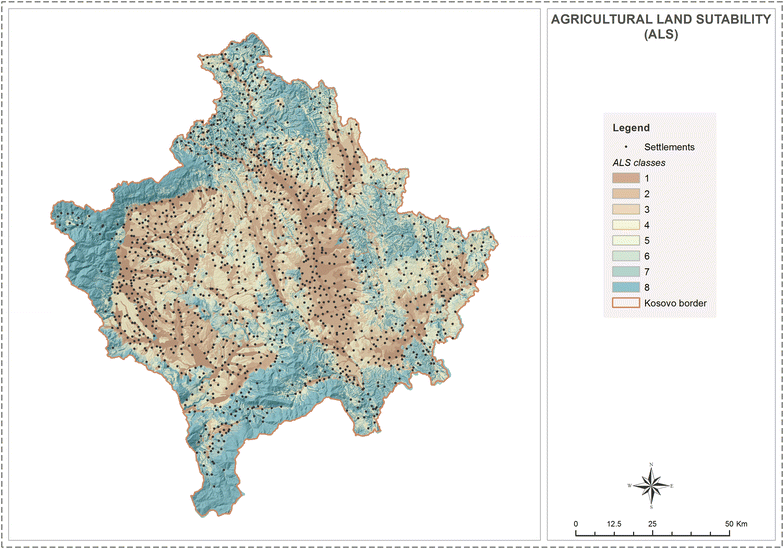
In Croatian practice, this approach has already been applied: in a master's thesis on the use of GIS in planning hazelnut cultivation in Vukovar-Srijem County, spatial factors affecting cultivation were identified, with the greatest significance given to terrain altitude and soil suitability from the soil map; data were standardized, consolidated, and overlaid to obtain a thematic suitability map, with the highest suitability found in the far east of the county (Ilok Municipality).
Advantages of the GIS approach:
- Objectivity — criteria and weights are recorded, so the decision is not a matter of impression.
- Comparability — multiple parcels receive the same type of rating and can be ranked.
- Scalability — the same model works for 1 ha and for 100 ha.
- Cost — using QGIS, ARKOD, and public maps, everything can be done without a single euro of license fees.
Step 1 — Define criteria (layers)
Scientific suitability models for hazelnut group criteria into two main groups — climatic and topographic conditions — and then into soil and (where relevant) pollution. In a Turkish study for the Black Sea region (the world's largest hazelnut growing area), the model used 7 main and 35 sub-criteria, with the highest weights given to altitude, mean annual temperature, mean annual precipitation, aspect, relative humidity, and slope.
For practical work at the parcel level in Croatia, 6 layers are sufficient:
| Layer (Criterion) | What it describes | Main data source |
|---|---|---|
| Climate | Temperature, precipitation, growing season | DHMZ climate maps/atlas |
| Soil | Soil type, depth, texture, pH | Soil Map (HCPHS / tlo.hr) |
| Slope | Terrain steepness (%) | DEM (digital elevation model) → QGIS |
| Aspect | Direction the terrain faces | DEM → QGIS (Aspect) |
| Water / Availability | Proximity of water for irrigation, groundwater | ARKOD, topographic maps |
| Frost / Frost pockets | Depressions where cold air accumulates | DEM (depressions) + local knowledge |
Climate
Commercial hazelnut cultivation is recommended (depending on latitude) at an altitude of 200–500 m; in a moderately continental climate, up to 600 m, and in southern (warmer) areas up to 800 m. Cultivation below 20 m along the coast is not recommended because sea air (salt) adversely affects the leaves. The climate layer is often the most heavily weighted because it sets the absolute framework — if the location is too cold or too wet, other criteria do not help.
Soil
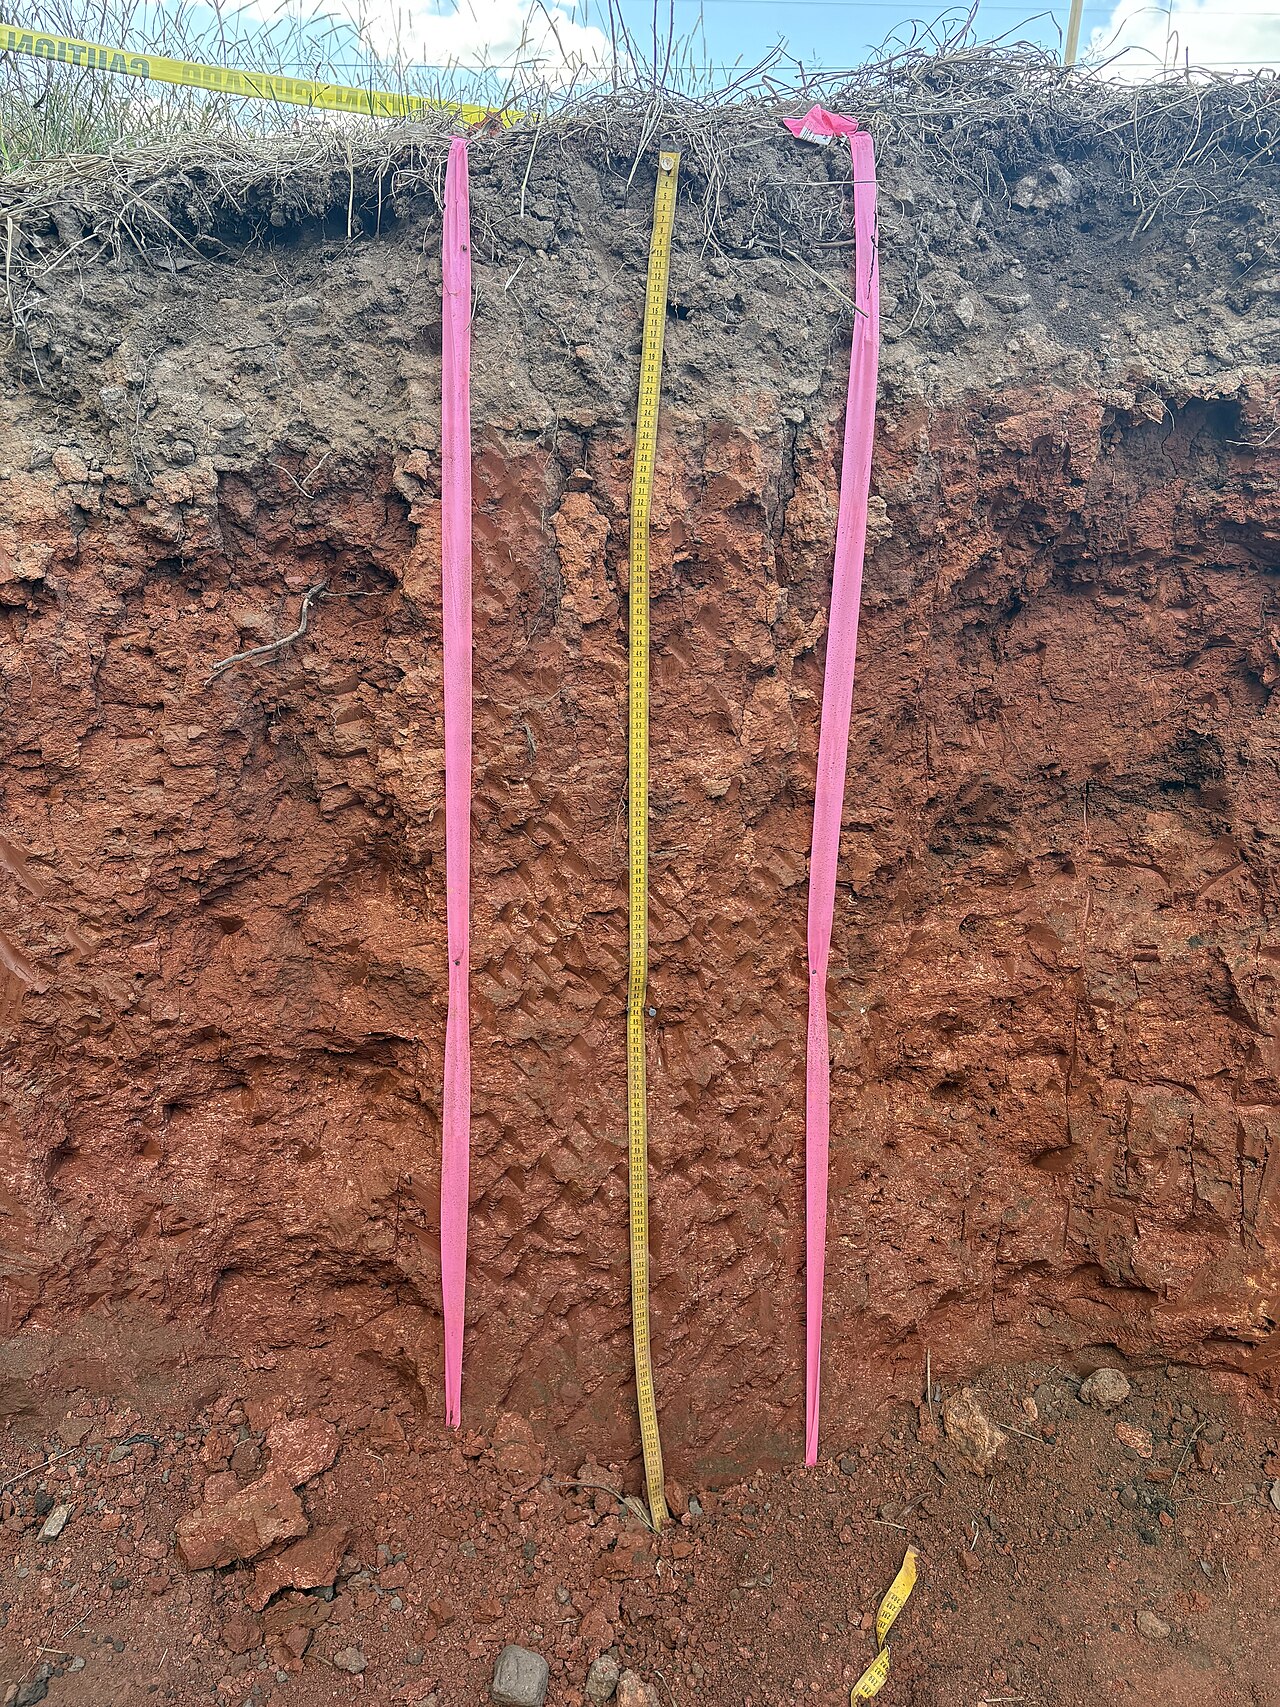
From the soil map and (mandatory) soil chemical analysis, you obtain the most important layer. Optimal values for hazelnut according to the Croatian Hazelnut Cultivation Guide (advisory service):
| Soil Indicator | Optimal | Broader Acceptable |
|---|---|---|
| pH (KCl) | 5.5 – 6.5 | 5.0 – 8.0 |
| Humus | 3 – 5 % | > 2 % |
| P₂O₅ / 100 g | 10 – 20 mg | — |
| K₂O / 100 g | 15 – 25 mg | — |
| Mg / 100 g | 10 – 20 mg | — |
Values are informative and depend on the cultivar, location, and analysis results; for larger orchards, avoid heavy soils with high active lime content (alkaline), and on acidic soils, perform liming based on the analysis. Hazelnut requires well-drained, permeable soils, and soils with high groundwater are unfavorable. It thrives best on deep, well-drained, sandy-loam and loamy soils of uniform profile; sandy, stony, and heavy clay soils are less favorable. The root mass is located at a depth of 10–40 cm (about 80 % up to 40–50 cm), making soil depth an important criterion.
Slope and Aspect
These are two layers that are easiest to obtain in GIS from a digital elevation model (DEM), and they are crucial for mechanization and frost risk.
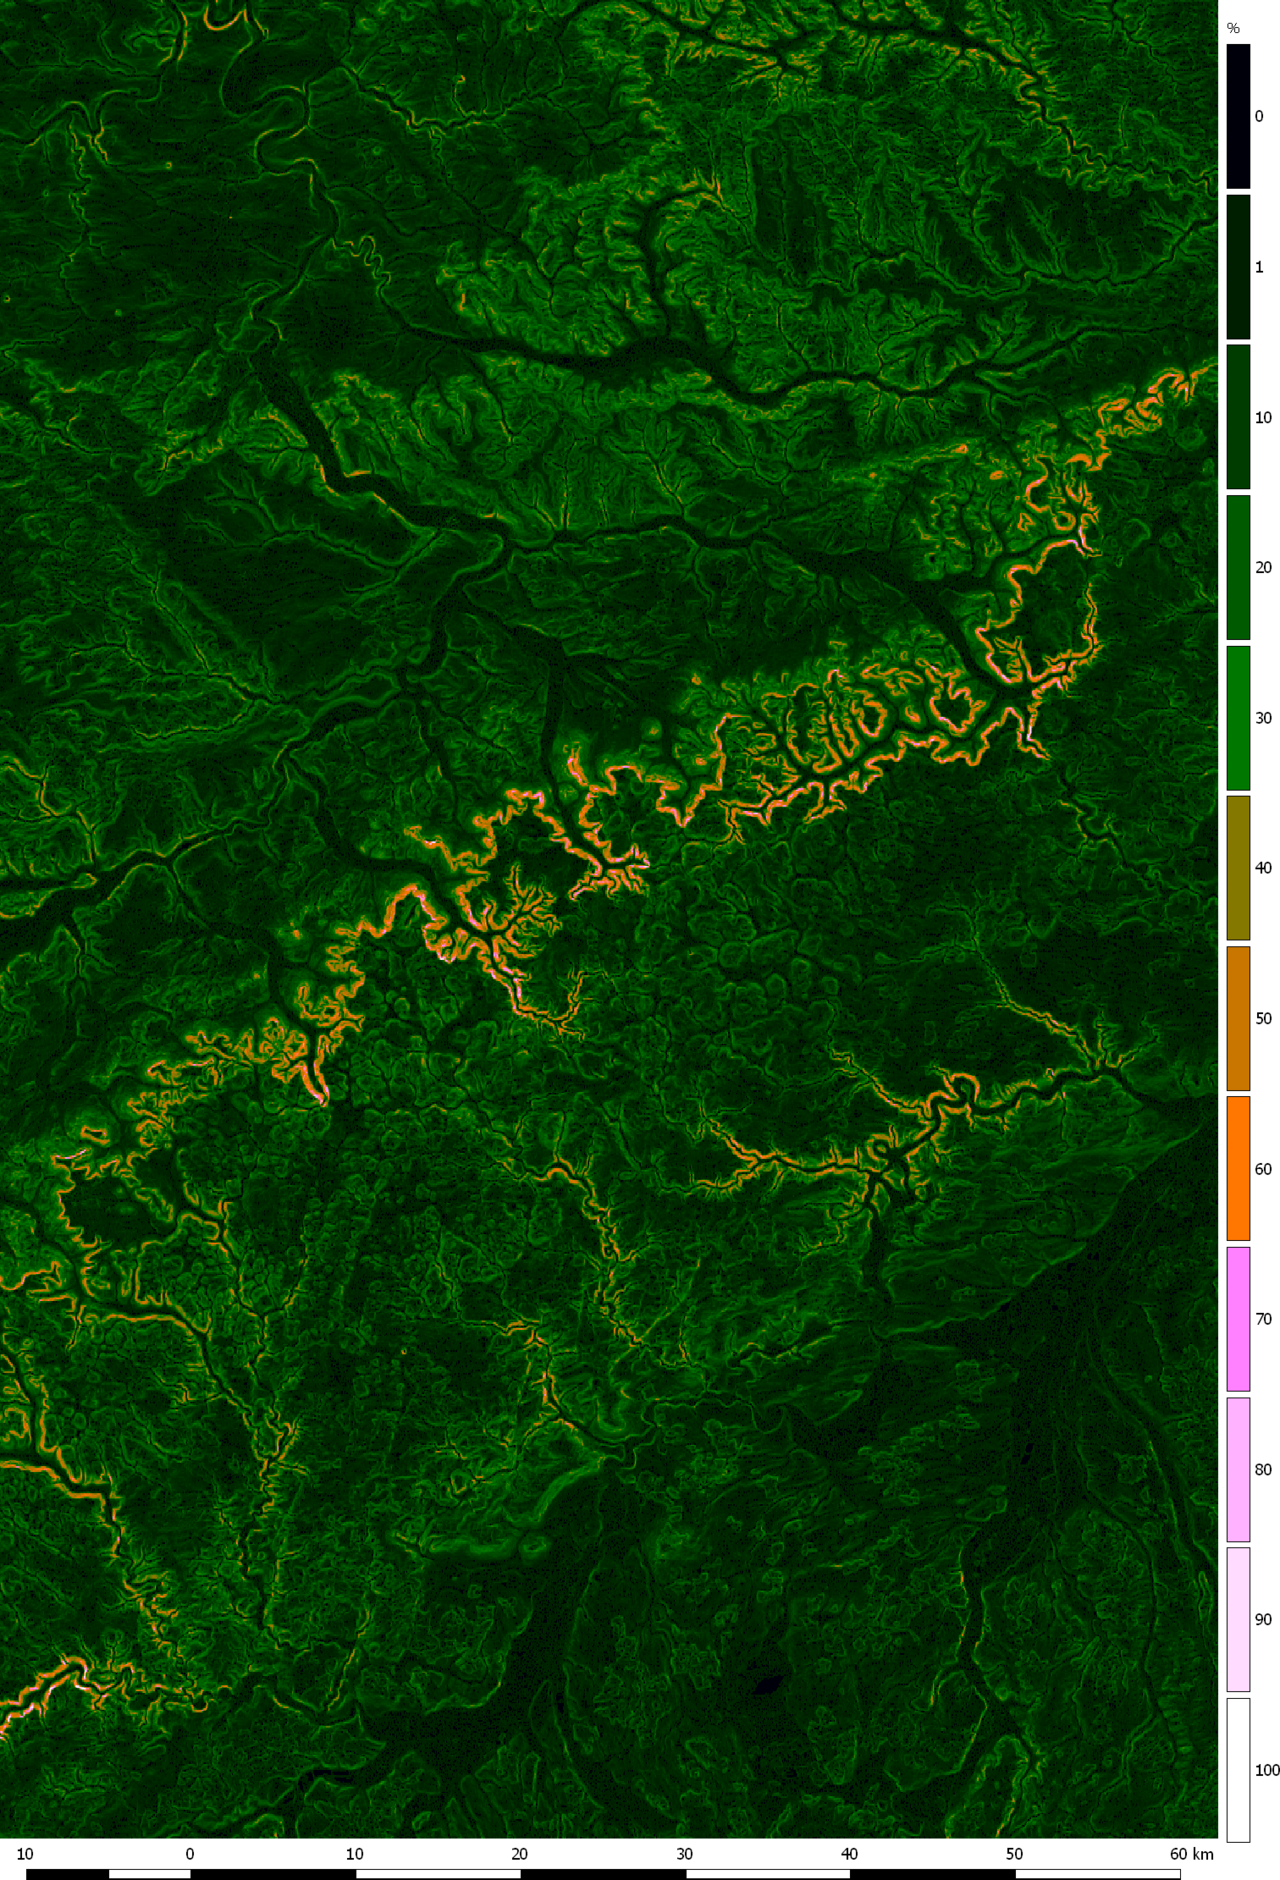
- Slope: optimal 3–10 %; technological guidelines for orchards specify a range of 4–8 % for easier mechanization; up to 15 % for the continental part. Flat terrain has problems with cold air drainage, and overly steep terrain prevents machine harvesting.
- Aspect: in the continental part, south, southeast, and east facing slopes are favorable (warm up faster in spring), while north and northwest are unfavorable. In warmer, coastal areas, the reverse applies — north, northeast, and northwest aspects are favorable, as they mitigate summer heat. It is best if the orchard itself is as flat as possible, while the surrounding terrain has a greater slope (uniform air temperature).
Water and Frost
Proximity to water and forest areas is desirable due to the mitigation of temperature oscillations and mandatory air drainage. The most dangerous are depressions and hollows where cold air, fog, and lower temperatures accumulate — late spring frosts in these areas damage the bloom and reduce yield. Ideal are wavy or elevated positions from which cold air flows downhill; the very tops of hills are not the best because they are most exposed to winter cold. In GIS, frost pockets are recognized as local depressions in the DEM (tool for calculating hollows / cold air accumulation).
Step 2 — Free tools and data (Croatia)
| Tool / Source | What it provides | Note |
|---|---|---|
| QGIS | GIS program for all processing and overlaying | Free, open source |
| ARKOD (arkod.hr) | Boundaries and IDs of agricultural parcels | Public viewer, export parcel shapes |
| Geoportal DGU (geoportal.dgu.hr) | Cadastre, orthophoto, DEM/altitudes | Official state geoportal |
| Soil Map (tlo.hr / HCPHS) | Soil type, soil suitability | Basis for the "soil" layer |
| DHMZ | Climate maps, temperatures, precipitation | Basis for the "climate" layer |
| DEM (digital elevation model) | Altitudes → slope, aspect, hollows | In QGIS: Slope, Aspect |
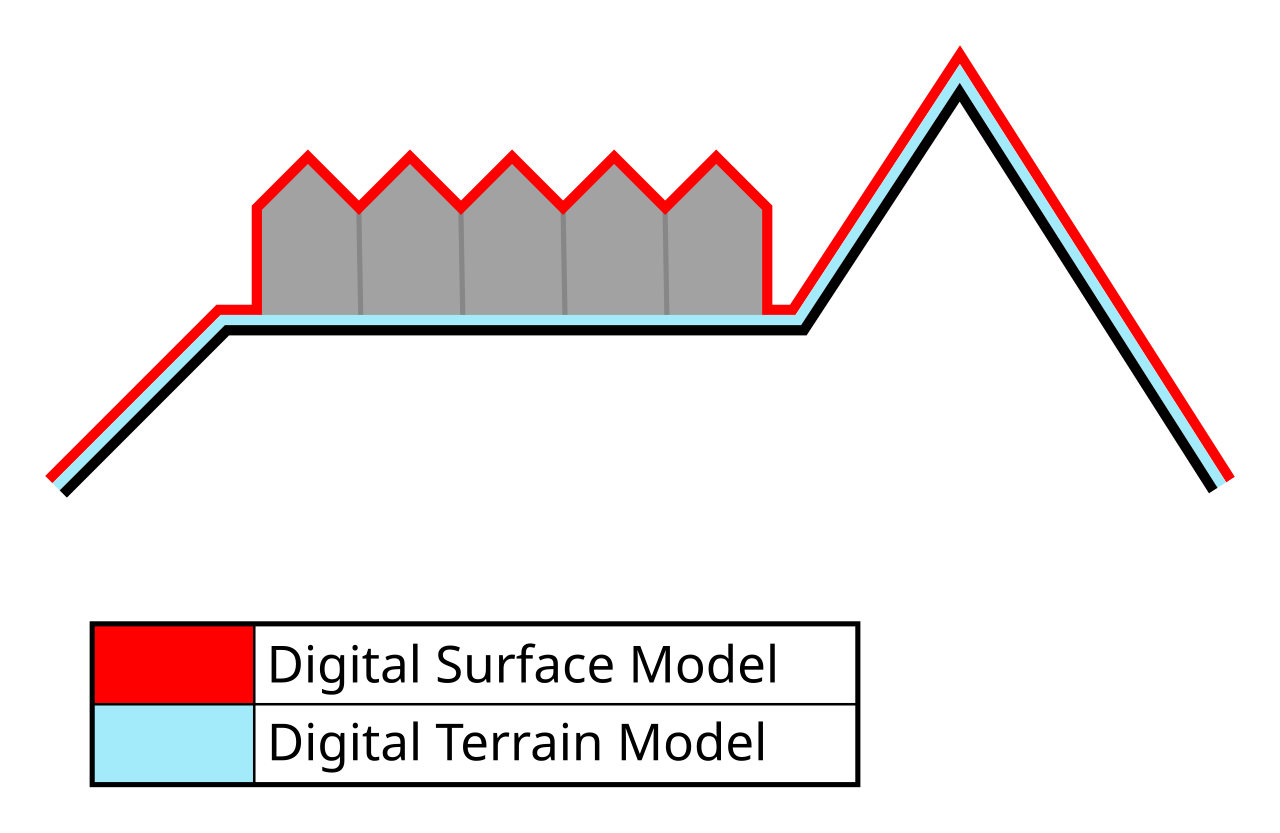
Workflow in QGIS (briefly):
- Import the parcel boundary (from ARKOD) and DEM.
- Calculate slope (Raster → Analysis → Slope) and aspect (Aspect) layers from the DEM.
- Import/digitize the soil and climate layers.
- Standardize all layers to a common scoring scale (e.g., 1–5).
- Assign weights and perform a weighted overlay (Raster Calculator or Weighted Sum).
- Classify the result into suitability classes and color the map.
Step 3 — Scoring layers (standardization)
To add different measurement units (slope percentages, degrees, pH, meters), each criterion is converted into points on the same scale, e.g., 1 (unsuitable) to 5 (very suitable). The scales below are proposed based on corpus values; adjust them to your climatic zone and cultivar.
Altitude (continental Croatia):
| Altitude | Points |
|---|---|
| 140 – 400 m | 5 |
| 400 – 600 m | 4 |
| 100 – 140 m | 3 |
| 600 – 800 m (warm areas) | 2 |
| < 100 m or > 800 m | 1 |
Terrain Slope:
| Slope | Points |
|---|---|
| 4 – 8 % | 5 |
| 3 – 4 % and 8 – 10 % | 4 |
| 10 – 15 % | 3 |
| 1 – 3 % (poor drainage) | 2 |
| > 15 % or completely flat | 1 |
Aspect (continental):
| Aspect | Points |
|---|---|
| S, SE, E | 5 |
| SW, NE transitions | 4 |
| W, flat | 3 |
| NNE | 2 |
| N, NW | 1 |
(In the coast, reverse the scale — north-facing aspects receive the highest points.)
Soil (pH KCl):
| pH | Points |
|---|---|
| 5.5 – 6.5 | 5 |
| 5.0 – 5.5 and 6.5 – 7.2 | 4 |
| 7.2 – 8.0 | 3 |
| < 5.0 (liming required) | 2 |
| > 8.0 (high active lime) | 1 |
Frost / Position:
| Position | Points |
|---|---|
| Elevated, wavy, good air drainage | 5 |
| Gentle slope, cold air runoff | 4 |
| Flat terrain near a larger river | 3 |
| Hilltop (winter exposure) | 2 |
| Hollow / frost pocket / depression | 1 |
Water (Irrigation):
| Water Availability | Points |
|---|---|
| Permanent source near the parcel | 5 |
| Well / possibility of abstraction | 4 |
| Water at > 500 m | 3 |
| Difficult access | 2 |
| No water + high groundwater | 1 |
| ## Step 4 — Weight Assignment (AHP / Weighted Overlay) |
Not all criteria are equally important. Weights are determined so that their sum equals 1.0 (100 %). The most common method in the literature is AHP (Analytic Hierarchy Process, Saaty), where criteria are compared in pairs (how much more important is A than B on a 1–9 scale) and weights are calculated from the matrix, checking the consistency ratio (CR < 0.1 means the assessments are logically consistent). In suitability studies for fruit crops (apple, grapevine, hazelnut), climate and topography consistently receive the highest weights, followed by soil.
Proposed weights for a hazelnut parcel in continental Croatia (adjust to your conditions):
| Criterion | Weight |
|---|---|
| Climate (incl. altitude) | 0.30 |
| Soil (type, depth, pH, drainage) | 0.25 |
| Frost / Aspect | 0.15 |
| Slope | 0.12 |
| Exposure | 0.10 |
| Irrigation Water | 0.08 |
| Total | 1.00 |
The final score for each cell (or parcel) is calculated as a weighted sum:
Score = (climate_score × 0.30) + (soil_score × 0.25) + (frost_score × 0.15) + (slope_score × 0.12) + (exposure_score × 0.10) + (water_score × 0.08)
Since scores range from 1 to 5, the final score will be between 1 and 5.
Suitability Classes (analogous to literature classes highly / moderately / marginally / not suitable):
| Score | Class | Map Color |
|---|---|---|
| 4.2 – 5.0 | Highly Suitable (S1) | Dark Green |
| 3.4 – 4.2 | Suitable (S2) | Light Green |
| 2.6 – 3.4 | Marginally Suitable (S3) | Yellow |
| 1.8 – 2.6 | Slightly Suitable (N1) | Orange |
| 1.0 – 1.8 | Not Suitable (N2) | Red |
Step 5 — Comparing Multiple Parcels (Practical Tool)
The main value of this approach is that you can reduce two or more parcels to a single number and rank them directly. For each parcel, fill in the score table, multiply by the weights, and sum them up.
Example comparison of three parcels:
| Criterion | Weight | Parcel A (score → ×weight) | Parcel B | Parcel C |
|---|---|---|---|---|
| Climate | 0.30 | 5 → 1.50 | 4 → 1.20 | 3 → 0.90 |
| Soil | 0.25 | 4 → 1.00 | 5 → 1.25 | 3 → 0.75 |
| Frost / Aspect | 0.15 | 5 → 0.75 | 3 → 0.45 | 2 → 0.30 |
| Slope | 0.12 | 5 → 0.60 | 4 → 0.48 | 2 → 0.24 |
| Exposure | 0.10 | 4 → 0.40 | 4 → 0.40 | 3 → 0.30 |
| Water | 0.08 | 3 → 0.24 | 4 → 0.32 | 5 → 0.40 |
| Total | 1.00 | 4.49 (S1) | 4.10 (S2) | 2.89 (S3) |
Conclusion from the example: Parcel A is highly suitable and the first choice; B is suitable (good soil, but slightly weaker aspect/frost protection); C is only marginally suitable and would require investments (liming, irrigation, frost protection) before becoming profitable.
You can maintain this table in a standard spreadsheet (e.g., free LibreOffice Calc) — GIS provides maps and spatial distribution within the parcel, while the table provides a quick ranking between parcels.
Practical Recommendations and Common Mistakes
- Do not skip soil analysis. A pedological map gives a rough picture; a chemical analysis (pH, humus, N-P-K) is mandatory before making a final decision. Sample in a zig-zag pattern from 8–10 points, depth 30–40 cm, total sample size approx. 1 kg; take separate samples for different parts of the parcel.
- Frost pockets are "silent killers" of yield. A parcel may have perfect soil and climate, yet lose its bloom every other year because it lies in a depression. Always check air drainage.
- Pay attention to climatic zones regarding exposure. Copying the "south = best" rule from the coast is a mistake — there, northern exposures are favorable.
- Check weight consistency. If the consistency ratio in AHP exceeds 0.1, re-compare the criteria — the assessments are likely contradictory.
- Validate the model in the field. The map is not truth in itself; compare its "highly suitable" zones with actually successful existing orchards in the vicinity (field validation is standard in peer-reviewed studies).
- Consider mechanization in advance. When establishing the orchard, leave space at the ends of rows for tractor/harvester turning; steep terrain (>15 %) practically excludes mechanical harvesting.
- Avoid extreme altitudes. Below ~140 m in the continental part, the risk of frost in lowlands increases, and above 600–800 m, the season shortens.
Gallery
Sources
This article is an AI summary compiled from an internal literature collection on hazelnut (RAG corpus) and public sources. Main sources used:
- Hazelnut Cultivation Guide — Ministry of Agriculture, advisory service (savjetodavna.mps.hr) — optimal soil values, altitude 100–400 m, slope 3–10 %, exposure, air drainage.
- Deak, M. (2017): Use of GIS in Agricultural Production Planning — Hazelnut Cultivation (diploma thesis, PFOS, Vukovar-Srijem County) — multi-criteria suitability analysis, layer overlay.
- Technological Guidelines for Orchards (Center for Fruit and Vegetable Growing, 2023) — slope 4–8 %, aspect, orientation, frost.
- Mechanization in Hazelnut Production and Processing (Minas-Zrno) (2021) — pH 5.0–8.0, soils.
- Investment Study for Hazelnut-based Products Production (Corylus avellana L.) (2019) — boundary altitudes 140–600 m.
- Impact of Low Temperatures on Frost Damage (2021) — altitudes 200–800 m, exposure by climatic zones, soil.
- Environmental protection studies for hazelnut orchards (Vojnić/AGRO Utinja 2021; Virovitica 2020; Vukojevci 2015) — pedology, site selection, Geoportal DGU.
- GIS-assisted site quality assessment for hazelnut cultivation using multi-criteria decision analysis (Black Sea region, Turkey) — https://link.springer.com/article/10.1007/s11356-021-18127-5 — 7 main and 35 sub-criteria, weights for climate/topography/soil.
- Field-validated apple orchard land suitability mapping using AHP-GIS — https://www.researchgate.net/publication/397171564 — AHP, weighted overlay, field validation.
- Enhancing land suitability assessment through integration of AHP and GIS (Scientific Reports, 2025) — https://www.nature.com/articles/s41598-025-14051-7
- Modeling climatic, terrain and soil factors using AHP in GIS for grapevines suitability (Wiley, 2025) — https://onlinelibrary.wiley.com/doi/full/10.1002/sd.3136
- Weighted Multi-Criteria Overlay Analysis — Spatial Thoughts — https://spatialthoughts.com/2022/01/31/multi-criteria-overlay-gdal/
- Public tools: QGIS (qgis.org), ARKOD (arkod.hr), Geoportal DGU (geoportal.dgu.hr), pedological data (tlo.hr / HCPHS), DHMZ (meteo.hr).
Recommended equipment
🔎 soil ph test kit — Amazon →Affiliate links — we may earn a small commission at no extra cost to you.
Handheld Soil pH Meter
For rapid field checks, but always confirm with laboratory analysis.
| Use Case | Option Type | What to Check Before Purchase |
|---|---|---|
| Quick field screening | Portable digital meter | Calibration stability and probe durability |
| Routine monitoring | Analog or digital | Temperature compensation features |
| Verification needed | Professional lab test | Sample preparation and reporting standards |