Remote Sensing, Drones, and Variable Rate Application
Content generated by artificial intelligence — verify before application
This article was automatically assembled from a collection of hazelnut literature using artificial intelligence and may contain errors or outdated information. It serves as a starting point for further research, not as professional advice. Dosages, products, and timing are informative and depend on the cultivar, location, and applicable regulations — always consult with an advisory service and official sources before application.
Remote sensing and precision agriculture have transitioned from academic papers to the daily practice of advanced orchard management over the last decade. For hazelnut growers, this means the ability to "see" an orchard of several dozen hectares from above — via satellite or drone — and, based on that data, not treat the entire area uniformly, but apply exactly as many inputs as each part of the orchard actually needs. This article explains how satellite and drone imagery work, what vegetation indices like NDVI are, how plant stress is detected early, and how GPS guidance and variable rate application (VRT) deliver savings while reducing environmental load.
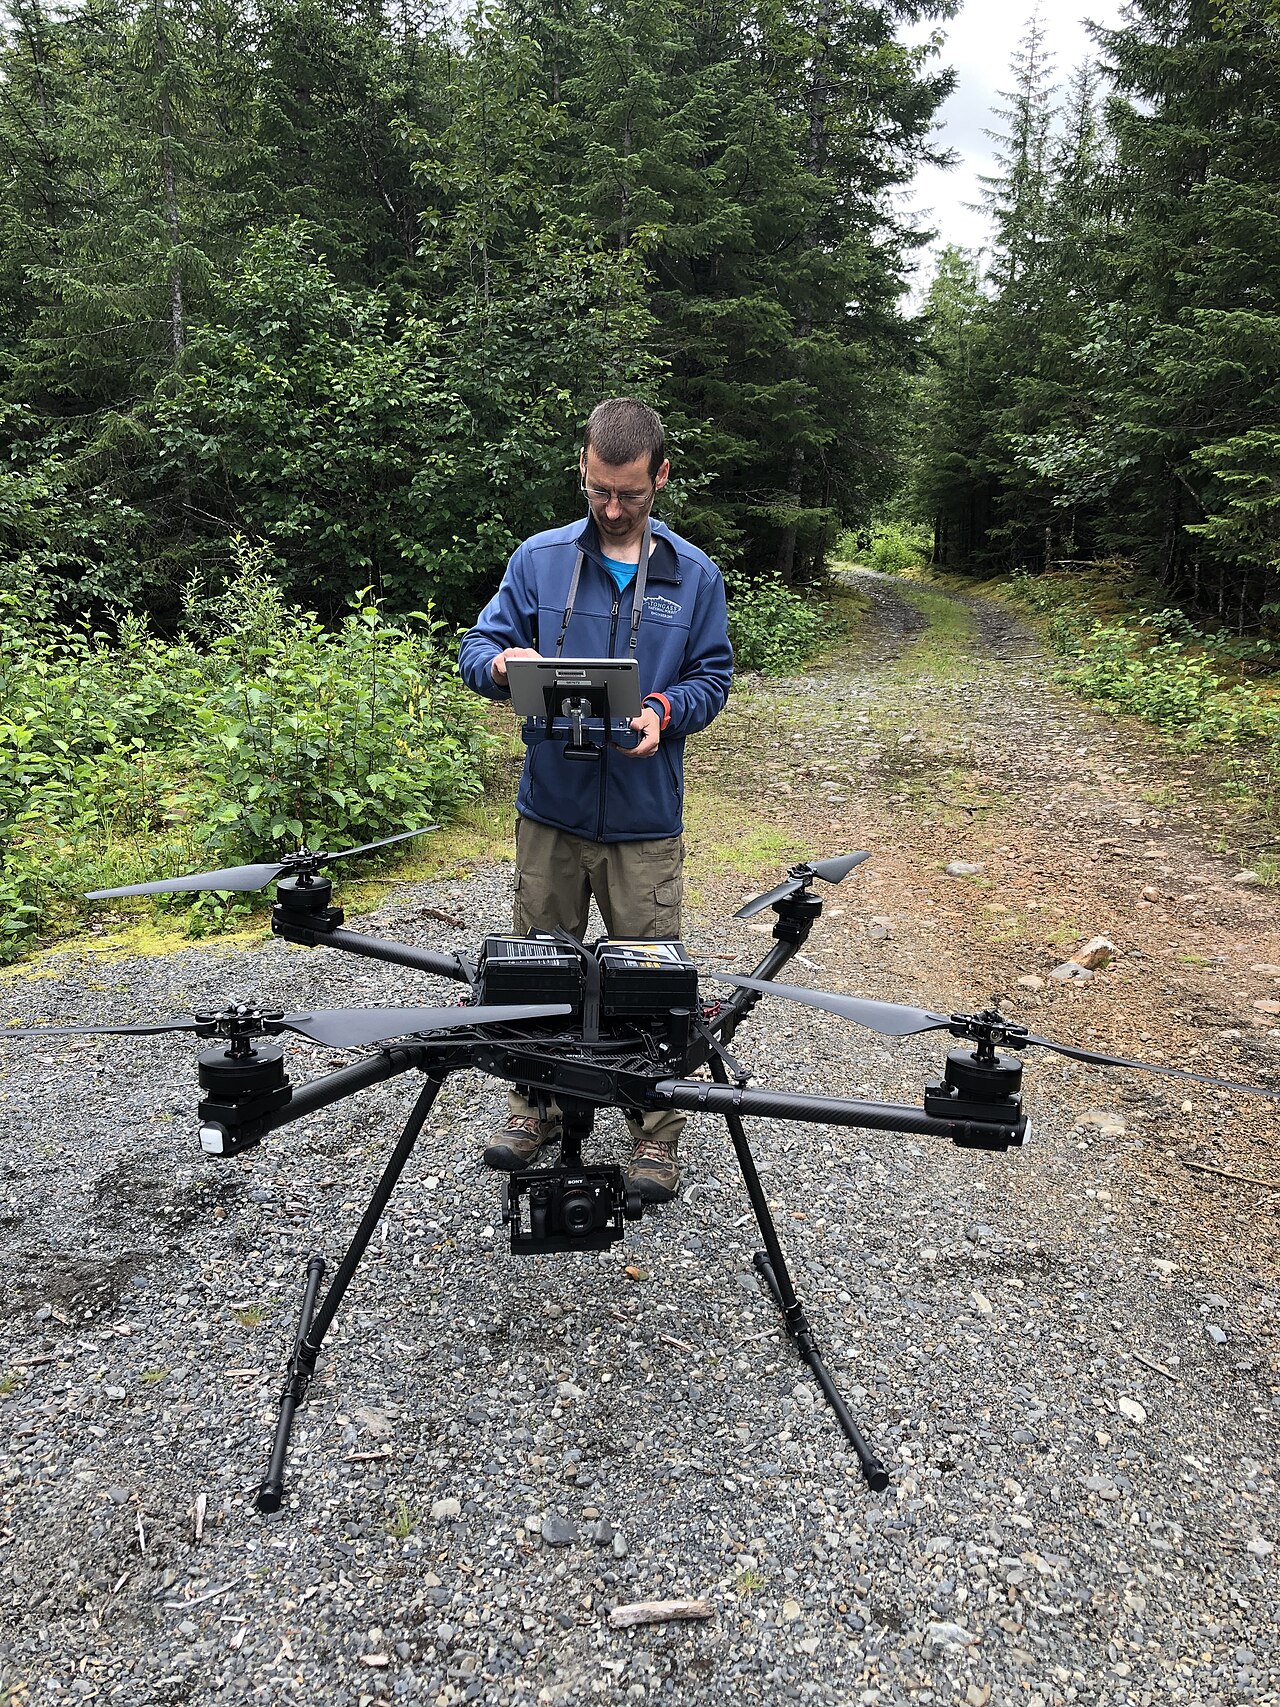
Why remote sensing in a hazelnut orchard?
Traditional orchard scouting relies on walking the rows and visual assessment, which is slow, subjective, and — as the orchard grows — increasingly difficult to execute. Inspecting every single tree in large orchards becomes impractical due to cost and time spent, while laboratory analyses provide answers with a delay. Remote sensing offers three key advantages:
- Coverage — the entire orchard is captured in a single flight or satellite pass.
- Objectivity — reflected light is measured, not impressions, making results comparable year after year.
- Timeliness — stressed plants change their light reflection before symptoms are visible to the naked eye, shortening reaction time.
Croatian sources confirm this directly: by using multispectral systems, "the time to detect plants under stress is reduced, allowing agricultural producers to react in time and prevent potential major damage" (Plant Protection Gazette 3/2023).
How the plant "talks" to the sensor: spectral reflectance
The foundation of everything is leaf physics. Chlorophyll in healthy plants absorbs a large portion (over 90%) of red visible radiation used for photosynthesis, while strongly reflecting near-infrared (NIR) radiation (around 50%) due to leaf tissue structure. A plant with weakened health — due to drought, powdery mildew, pest attacks, or nutrient deficiency — absorbs less red and reflects less infrared radiation than a healthy plant. Sensors convert this difference into numbers and maps.
That is why standard RGB cameras are insufficient: for serious health analysis, a multispectral (or thermal/hyperspectral) camera is required, which records invisible parts of the spectrum.
Satellite imagery: cheap, regular baseline
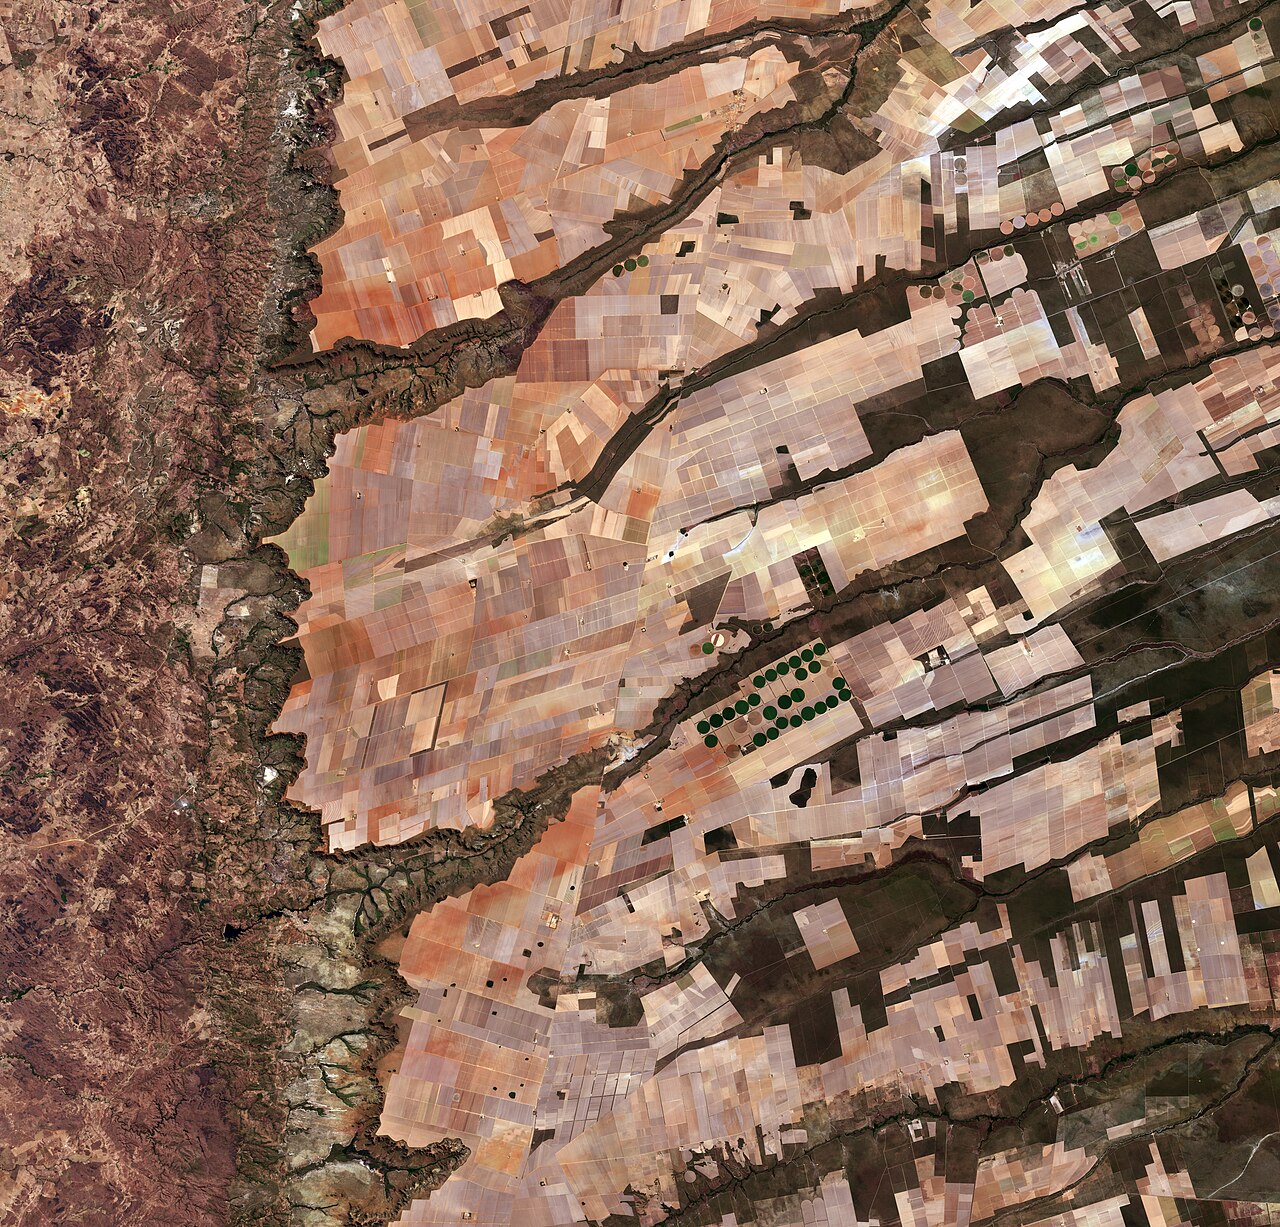
The satellite platform most frequently mentioned in hazelnut literature is the European Sentinel-2 (Copernicus program, ESA). Its advantages are free data and regular image repetition.
| Feature | Sentinel-2 | Drone (UAV) |
|---|---|---|
| Spatial resolution | ~10 m per pixel (visible/NIR) | few cm/pixel |
| Frequency | every few days (depending on cloud cover) | on demand, as needed |
| Data cost | free | equipment/service cost |
| Analysis level | orchard / zones | individual tree |
| Limitations | clouds, coarse resolution | battery, flight time, permits |
In practice, satellite and drone data complement each other: the satellite provides a cheap, regular overview of the entire orchard and alerts where "something is wrong," and then the drone is sent specifically to that zone for detailed imaging of individual trees. Research explicitly states that low-cost and ground-based sensors are used to build more reliable calibrations for drone and satellite models (Sensors, 2024).
It is also worth mentioning that remote sensing is used for inventory and area control: in the Turkish province of Sakarya, NDVI classification of satellite images identified approximately 87,374 ha of hazelnut, of which only 47,263 ha were legally permitted (Planning and Controlling of Hazelnut Production Areas, 2013).
Vegetation indices: NDVI and its "relatives"
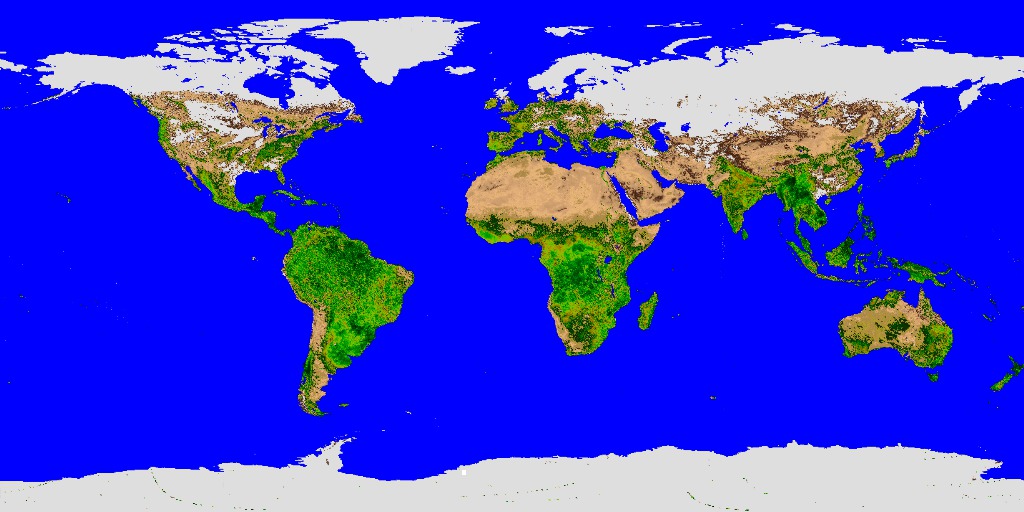
Raw spectral data is converted into vegetation indices — simple ratios of reflected light that provide a map of "greenness," or photosynthetic activity.
NDVI — Normalized Difference Vegetation Index
The most famous and most frequently used index. It is calculated as:
NDVI = (NIR − Red) / (NIR + Red)
For Sentinel-2, these are bands B08 (NIR, ~842 nm) and B04 (red, ~665 nm). The value ranges from −1 to +1:
| NDVI Value | Typical Meaning |
|---|---|
| < 0 | water, bare/dead surface |
| 0 – 0.2 | bare soil, very sparse vegetation |
| 0.2 – 0.5 | moderate vegetation / stress |
| 0.5 – 0.8+ | dense, vital vegetation |
On an NDVI map, green areas indicate vigorous growth, while yellow-red zones indicate stress or poor growth. Values are indicative — they depend heavily on the crop, phenological stage, and season, so they should be interpreted in the context of your own orchard, not as absolute thresholds.
Additional indices for greater precision
Due to NDVI limitations (saturation in dense canopies, soil influence), other indices are also used:
- SAVI (Soil-Adjusted VI) — introduces a correction factor for soil brightness; very useful in young hazelnut orchards where plant coverage is low and much bare soil is visible between rows.
- NDRE (Red-Edge) — more sensitive to nitrogen and chlorophyll levels in developed canopies; successfully used to detect uneven irrigation in olive groves and can alert to problems before NDVI.
- GNDVI, NDWI, EVI — alternatives that Croatian sources cite as complements to NDVI for greater reliability.
Practical advice: in an orchard with significant bare surface between rows, prioritize SAVI, and for finer assessment of nutrient status in a developed canopy, consider NDRE.
Detecting stress: water, nutrients, diseases, and pests
Multispectral and thermal imaging enables early detection of multiple types of stress simultaneously:
- Water stress — thermal cameras measure canopy temperature; a plant closing stomata due to drought becomes warmer. From this, the crop water stress index (CWSI) is calculated. In research, reference values such as stem water potential around −6 bar, leaf conductance ~0.2 mol m⁻² s⁻¹, and CWSI ~0.2 are mentioned (Sensors, 2024) — all informative and dependent on cultivar, location, and calibration.
- Nutrient deficiency — hyperspectral and multispectral imaging reveals micro-areas with nutrient deficits, enabling spot dosing and reduced losses (Compendio di Vivaistica Forestale, 2023).
- Diseases and pests — cameras can detect rust spots on leaves and fungal diseases before spread; drones have successfully detected stress caused by insects. NDVI in Croatian literature is linked to monitoring orchard vitality during prolonged drought, powdery mildew, and other factors.
Key message: the index does not state the cause, but shows where the problem is. The map directs targeted field scouting (ground-truthing), and only on-site diagnosis or laboratory analysis confirms what is happening.
GPS guidance and precision navigation
The second pillar of precision agriculture is GPS (Global Positioning System). Croatian sources cite three interrelated systems: GPS for navigation, GIS for storage and analysis of spatial data, and VRT (Variable Rate Technology) for variable application (Plant Protection Gazette 3/2023).
What GPS brings to the orchard:
- Precise machine guidance using autopilot reduces pass overlap. GPS-guided tractors reduce fertilizer overlap by approximately 10–15 %, directly saving inputs and fuel.
- Problem mapping — areas of disease, pest, or weed attack can be precisely located and revisited.
- Traceability — with GPS localization, full traceability of production by individual orchard sections is possible.
GIS serves as the "memory" of the farm: soil maps, NDVI images across seasons, and treatment records are stored in it, enabling zoning and economic assessments (examples of ArcGIS usage and kriging geostatistics in soil fertility analysis in eastern Croatia).
Variable Rate Technology (VRT): From Map to Prescription Rate
The pinnacle of the entire process is variable rate application — inputs are not distributed uniformly, but rather "how much, when, and where" is needed. Italian national guidelines for precision agriculture define it precisely as variable application of inputs in terms of precision: when, how much, and where, with the aim of reducing chemical and water inputs (SRA24, 2023).
The workflow looks like this:
- Imaging — satellite/drone collects multispectral (and thermal) data.
- Indices and Zoning — based on NDVI/SAVI/NDRE maps, the orchard is divided into zones of varying vitality.
- Prescription Map — each zone is assigned a targeted dose of fertilizer, water, or crop protection product.
- Application — GPS-guided machinery (spreader, sprayer, irrigation system, or drone sprayer) automatically adjusts the dose according to the map and position.
Fertilization Zoning — Where VRT Helps Most
Hazelnut fertilization is already based on soil analysis, soil type, training system, orchard age, and phenological stage (Hazelnut Cultivation Guide, savjetodavna.gov.hr). VRT adds a spatial dimension: instead of one "average" dose for the entire orchard, weaker zones receive more, while vigorous zones receive less. Reference doses from the corpus that can serve as a starting point for zoning (all informative, depending on cultivar, soil, and regulations/label):
| Treatment / Phase | Reference Dose from Literature | Note |
|---|---|---|
| Soil amelioration (pre-planting) | 1,200–3,000 kg/ha NPK + 25–50 t/ha organic | e.g., NPK 7-20-30 / 8-26-26 |
| Liming of acidic soils | 4–12 t/ha CaCO₃ | according to pH from soil analysis |
| Nitrogen, young orchard (per tree) | 0.5 → 1.0 kg/tree (1st–4th year) | CAN 27%, early spring |
| Full production (surface application) | ~150 kg/ha K, ~20 kg/ha P, ~100 kg/ha N | according to soil analysis |
| Foliar zinc (Zn-EDTA) | 1.0–1.5 kg/ha (microgranules) or 2.0–3.0 L/ha (liquid) | summer top-dressing |
Variable rate application makes the most sense for these treatments: expensive soil amelioration and liming can be zoned according to pH and fertility maps, while foliar and nitrogen top-dressings can be zoned according to NDVI/NDRE vitality zones.
Drone Spraying
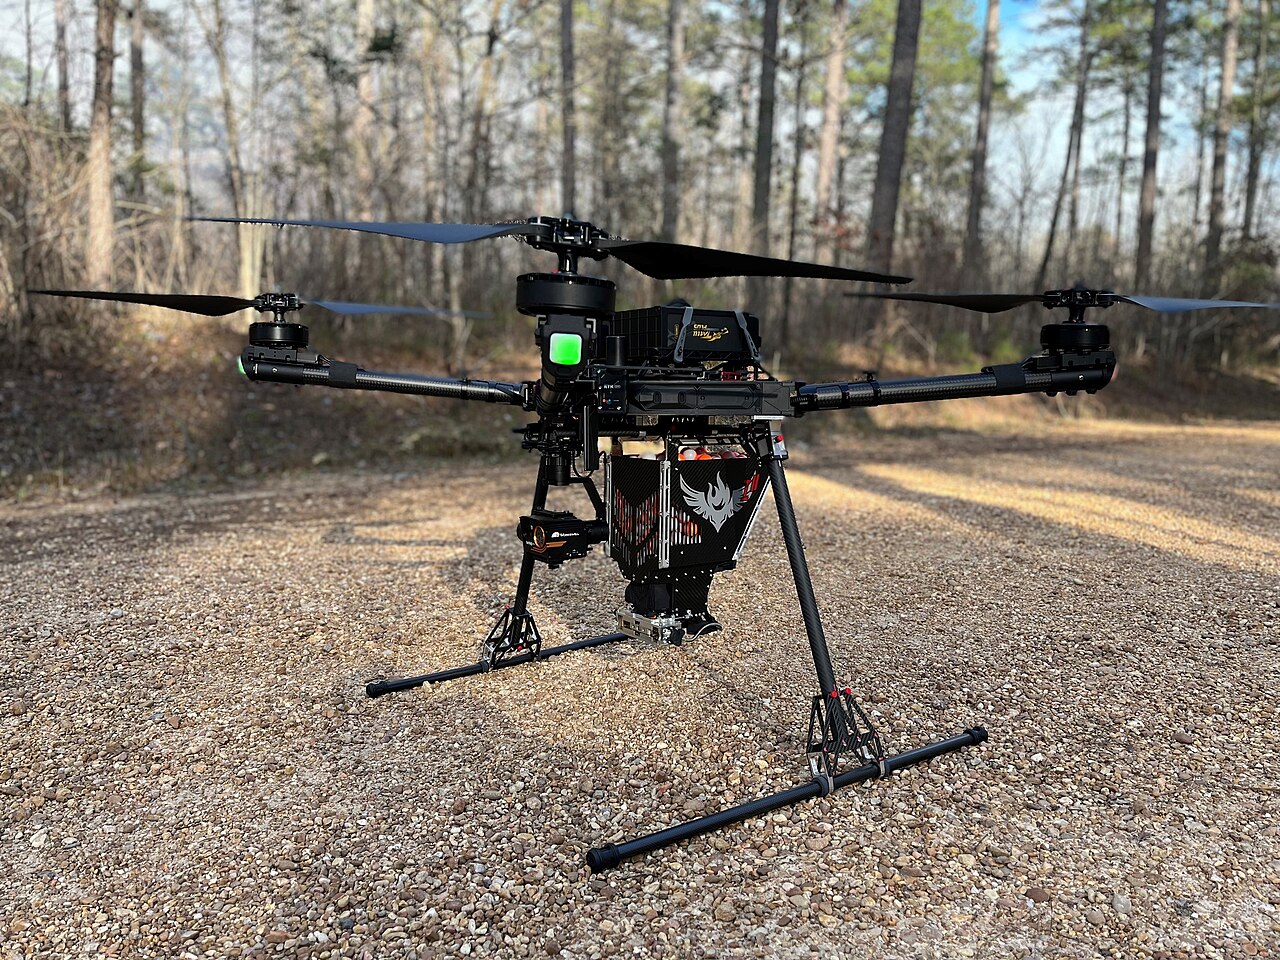
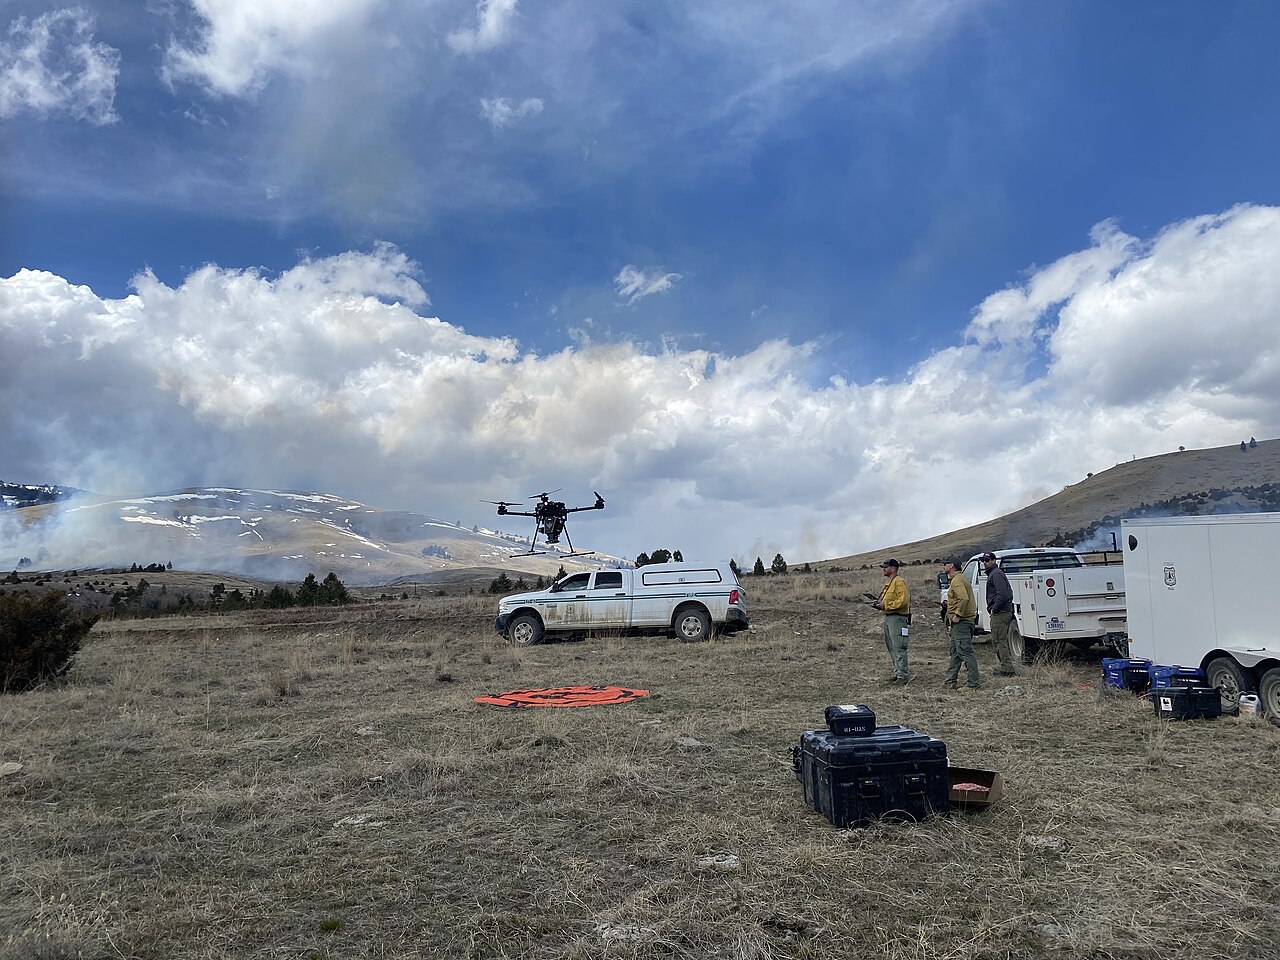
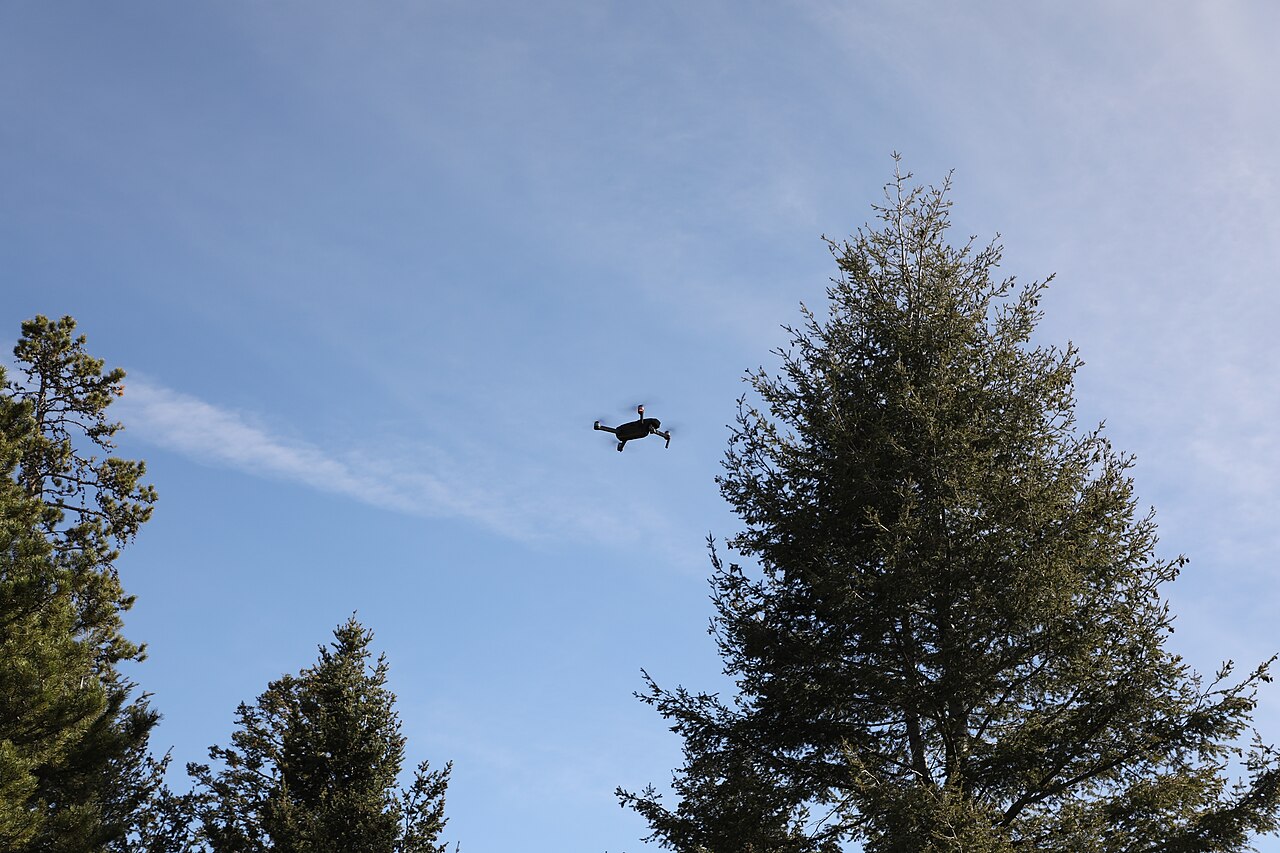
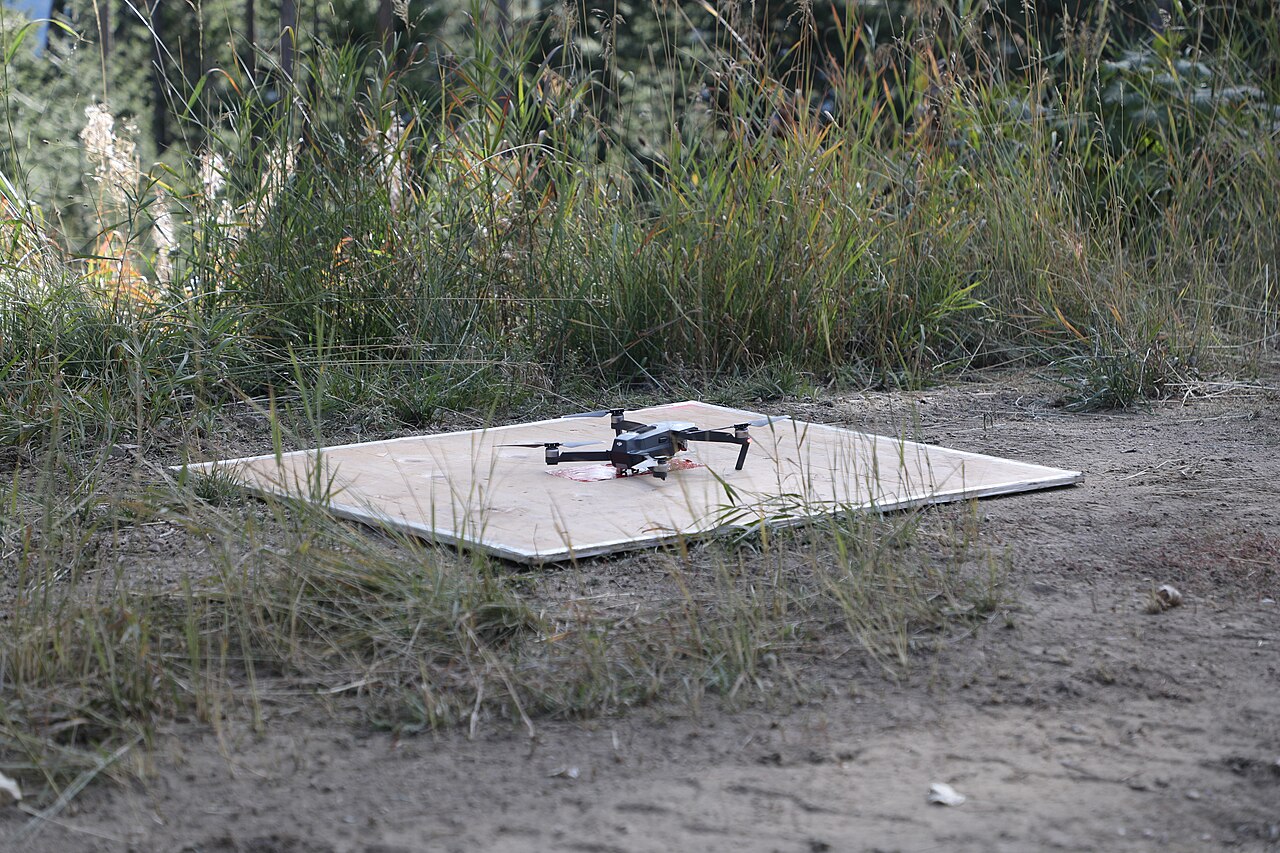
Drones are increasingly used for the actual application, especially where it is difficult to access with a tractor. Research on drone spraying parameters in hazelnut orchards investigated application rates on the order of 1–3 L/da (liters per decare) at flight heights of approximately 1.5–2.0 m above the canopy (Determination of the Application Parameters of Spraying Drones, 2022) — these values are experimental and depend on the product, nozzles, and conditions.
How Much Can Be Saved
Figures from public sources (indicative, depending on crop, equipment, and initial state):
- Precision agriculture can yield up to ~25% savings on fertilizer and crop protection costs.
- Variable rate application typically reduces fertilizer and pesticide consumption by 15–30% while increasing net profit by approximately 8–12% per hectare.
- GPS guidance reduces fertilizer overlap by 10–15%.
In addition to financial savings, there is an environmental benefit: less chemicals and water means less pressure on soil and groundwater, which aligns with EU policy goals and national guidelines for precision agriculture.
Practical Recommendations and Common Mistakes
Recommendations
- Start cheap: free Sentinel-2 NDVI maps (e.g., via open platforms) are sufficient for initial orchard zoning without any investment.
- Image multiple times through the season and track changes, not just a single image — the trend is more informative than a single value.
- Always conduct a field verification: the index shows where, the field visit reveals why.
- In young orchards, use SAVI to reduce the influence of bare soil.
- Store all maps and treatment records in GIS — the value of data increases year by year.
Common Mistakes
- Interpreting absolute NDVI thresholds "by rule" without considering cultivar, phenological stage, and location.
- Imaging with poor sun geometry or through clouds (satellite) — data becomes unreliable.
- Relying solely on RGB cameras for health assessment instead of multispectral.
- Uncalibrated prescription maps → incorrect dose; literature doses are a starting point, not a recipe.
- Ignoring regulations: drone spraying and product application are subject to legal regulations and product labels — check permissions before application.
Gallery
Copernicus and Free Satellite Services for Croatian Fruit Growers
A large part of the analysis described above can be performed by Croatian growers without investing a single cent. The Copernicus program (EU/ESA) offers the entire archive and new satellite Sentinel images on the principle of complete, free, and open data availability. For fruit growers, this means that a Sentinel-2 NDVI image of their plot can be retrieved from a browser in a web browser, without installation or payment.
Which Free Platforms Exist
| Service | What it Offers | Who it is For |
|---|---|---|
| Copernicus Browser (dataspace.copernicus.eu) | Official browser of the Copernicus Data Space Ecosystem; Sentinel-1/2/3/5P, ready-made layers (true/false color, NDVI, NDWI…), image download | Beginners — everything "on click" |
| EO Browser (Sentinel Hub) | Similar browser with time slider, date comparison, and custom scripts for indices | Those who want animations and time series |
| Google Earth Engine (GEE) | Programmable processing of petabytes of images in the cloud; monthly median composites without clouds | Advanced users and agronomists |
| EDO — European Drought Observatory (JRC) | Drought maps and time series (combined drought index ~5 km, every 10 days) | Monitoring drought risk for irrigation |
| EFFIS | Early warning and monitoring of forest fires | Orchards near forests/risky areas |
| Copernicus Land Monitoring Service | Land cover/use layers and vegetation status | Planning and zoning |
In scientific papers on hazelnuts, this free chain is used routinely: Sentinel-2 provides imagery with a resolution of 10 m every ~5 days, and processing (cloud filtering, monthly median composites, calculation of NDVI/SAVI/EVI) most often runs through Google Earth Engine (Lodato et al., 2024; Hunt AgTech, 2024). Slovenian and Croatian authors have used Sentinel-2 L2A 10 m images to monitor orchard vitality during prolonged drought, powdery mildew, and pest attacks (Proceedings of the 64th/67th Plant Protection Seminar).
Step by Step: NDVI for Your Own ARKOD Plot
The goal is to obtain an NDVI image of your exact plot. The plot location is easiest to determine via the ARKOD browser (arkod.apprrr.hr), where the boundaries and coordinates of your ARKOD plot are visible; these boundaries (or cadastral parcel) are then transferred to the satellite browser.
- Open Copernicus Browser at
dataspace.copernicus.euand create a free account (registration is mandatory for viewing and downloading). - Find the plot — enter the place or coordinates from ARKOD in the map search, or manually navigate to your orchard. Optionally, load the plot boundary as a polygon (e.g., KML/GeoJSON exported from GIS).
- Select satellite and date — in the menu, select Sentinel-2 L2A (atmospherically corrected level) and a date with low cloud cover; set the cloudiness filter to e.g., < 10–30 %.
- Select NDVI layer — from the list of ready-made visualizations, select NDVI. The browser calculates it from bands B08 (NIR) and B04 (red) according to the formula NDVI = (B08 − B04) / (B08 + B04). Green zones are vigorous, yellow-red warn of stress.
- Track the time series — change the date through the season and compare images; the trend across several images is more informative than a single picture. EO Browser has a slider and "before/after" comparison for this.
- Download or export — save the image as a picture or georeferenced GeoTIFF for further processing in GIS (QGIS is free) and for creating prescription maps for VRT.
Practical note: Sentinel-2 does not reliably see very young orchards (younger than ~4 years) because the canopy is small relative to the 10 m pixel (Lodato et al., 2024) — in such cases, the free satellite will serve for rough orientation, but for detailed per-tree assessment, a drone is still needed. Additionally, for assessing drought risk during the season, it is worth periodically checking the EDO combined drought index for your region and aligning irrigation accordingly.
In conclusion: the combination of ARKOD (where the plot is) + Copernicus Browser/EO Browser (NDVI image) + EDO (drought risk) provides Croatian fruit growers with a completely free, repeatable tool for initial orchard zoning — without equipment, subscription, or special software.
Sources
This article is an AI-generated summary compiled from an internal hazelnut literature collection (RAG corpus) and supplemented with public internet sources. The main sources used include:
- Plant Protection Bulletin 3/2023 — HDBZ (multispectral imaging, NDVI, GPS/GIS/VRT, early stress detection)
- Proceedings of the 67th Plant Protection Seminar, 2025 (NDVI, Sentinel-2 vitality monitoring)
- Hazelnut Cultivation Guide — Ministry of Agriculture / savjetodavna.gov.hr (fertilization criteria and rates)
- Coupling Satellite-Derived Vegetation Indices… — https://doi.org/10.1080/15481603.2025.2578778 (NDVI from Sentinel-2, formula and range)
- Hunt AgTech / Remote Sensing in Hazelnut Orchards — https://doi.org/10.3390/s25010288 (SAVI, orchard vs. forest monitoring)
- Detection of Irrigation Inhomogeneities… (NDRE, UAV) — https://doi.org/10.3390/horticulturae10050516 (water stress, thermal indices, CWSI)
- Low-cost crop stress monitoring (LOCOS/IRT) — https://doi.org/10.3390/s24237764 (calibration of drone and satellite models, CWSI)
- Determination of the Application Parameters of Spraying Drones for Crop Protection in Hazelnut Orchards, 2022 (drone spraying parameters)
- Planning and Controlling of Hazelnut Production Areas with Remote Sensing, 2013 (NDVI area classification, Sakarya)
- Compendio di Vivaistica Forestale, 2023 (hyperspectral detection of nutrient deficiencies, GPS traceability)
- SRA24 — Agricoltura di precisione, 2023 (definition of variable input application; Italian/EU guidelines)
- Foliar fertilization of hazelnut (Zn-EDTA rates) and Hazelnut Cultivation Guide (ameliorative fertilization, calcification)
- DroneDeploy — Identifying Crop Variability with Drones — https://www.dronedeploy.com/blog/identifying-crop-variability-with-drones
- Advexure — Aerial Multispectral Data: The Foundation of VRT — https://advexure.com/blogs/news/aerial-multispectral-data-the-foundation-of-variable-rate-technology-in-precision-agriculture
- K-State Agronomy eUpdate — Basics of remote sensing in precision agriculture — https://eupdate.agronomy.ksu.edu/article/the-basics-of-remote-sensing-in-precision-agriculture-664-7
- Farmonaut — GPS for Precision Farming — https://farmonaut.com/precision-farming/gps-for-precision-farming-7-powerful-ways-to-boost-yields
- AllyNav — Precision Agriculture GPS, Complete Guide — https://www.allynav.com/blog/precision-agriculture-gps/
- USDA ARS — Benefits and Evolution of Precision Agriculture — https://www.ars.usda.gov/oc/utm/benefits-and-evolution-of-precision-agriculture/
- Lodato et al. — In-Depth Analysis of a Hazelnut Agro-Industrial Context (Viterbo) — https://doi.org/10.3390/rs16071227 (Sentinel-2 processing in Google Earth Engine, monthly median composites, limitation for young orchards <4 years)
- Hunt AgTech / Hazelnut mapping detection system (optical + radar) — https://doi.org/10.3390/rs16071227 (Sentinel-1/2 processing in GEE, cloud cover threshold)
- Detection of Hazelnut Orchards with Sentinel-2 — https://doi.org/10.5194/isprs-archives-xlviii-4-w18-2025-301-2026 (resolution 10/20/60 m, frequency ~5 days, indices NDVI/SAVI/EVI)
- Proceedings of the 64th and 67th Plant Protection Seminars (Sentinel-2 L2A 10 m, NDVI, orchard vitality monitoring)
- Copernicus Data Space Ecosystem / Copernicus Browser — https://dataspace.copernicus.eu/ and documentation https://documentation.dataspace.copernicus.eu/Applications/Browser.html (free access, NDVI from bands B4/B8, registration required)
- Sentinel Hub — EO Browser — https://www.sentinel-hub.com/explore/eobrowser/
- Copernicus Sentinel-2 — Data Space Ecosystem — https://dataspace.copernicus.eu/data-collections/copernicus-sentinel-missions/sentinel-2
- European Drought Observatory (EDO) / JRC — https://www.copernicus.eu/en/european-drought-observatory and https://joint-research-centre.ec.europa.eu/european-and-global-drought-observatories_en (combined drought index ~5 km / 10 days)
- EFFIS — European Forest Fire Information System (Copernicus EMS) — https://effis.jrc.ec.europa.eu/
- ARKOD Browser — Agency for Payments in Agriculture, Fisheries and Rural Development — https://arkod.apprrr.hr/ and https://www.apprrr.hr/arkod/ (identification of ARKOD parcel boundaries and coordinates)