Decision Support Systems (DSS) and Forecasting Models for Hazelnut
Content generated by artificial intelligence — verify before application
This article was automatically compiled from a collection of hazelnut literature using artificial intelligence and may contain errors or outdated data. It serves as a starting point for further research, not as professional advice. Dosages, products, and timing are informative and depend on the cultivar, location, and applicable regulations — always consult an advisory service and official sources before application.
A Decision Support System (DSS) is a digital tool that collects, links, and analyzes data from multiple sources — weather stations, soil sensors, satellite and drone imagery, and agronomic models — to provide the producer with concrete recommendations at the right moment: when (and whether) to treat against diseases, when to irrigate and how much, and when to initiate frost protection. It is important to emphasize what the literature highlights: DSS does not replace the grower or agronomist, but provides them with additional information for better decision-making. In hazelnut (Corylus avellana), a perennial crop with a long production cycle and sensitive flowers, this type of tool bridges the gap between "hard" sensor technology (IoT, remote sensing) and daily agronomic practices. This article explains which models and systems are available and how they are used in practice.
What is a DSS and why specifically in a hazelnut orchard?
Traditionally, decisions in the orchard are made based on experience and established practices (calendar-based). While this approach is proven, it increases the margin of error: treatments are applied when there is no risk, irrigation is done "by feel," and frost catches the night shift off guard. The DSS formalizes this process into three steps:
- Data collection — agrometeorological station, soil and leaf moisture sensors, satellite/drone indices, phenological observations.
- Processing and modeling — mathematical models convert raw data (temperature, moisture, precipitation, leaf wetness hours) into risk indices or recommendations.
- Recommendation and action — the grower receives a warning (e.g., SMS/app) or the system automatically triggers an action (e.g., irrigation valve).
In the PANTHEON project (H2020), which developed a SCADA system for precision hazelnut cultivation and validated it on a commercial orchard in Nepi, Italy, the user in the interface "analyzes the proposals generated by the decision support system," approves valid ones, rejects unnecessary ones, and work planning can be both manual and automatic. This is a good model of how a DSS looks in practice: proposal → human confirmation → execution.
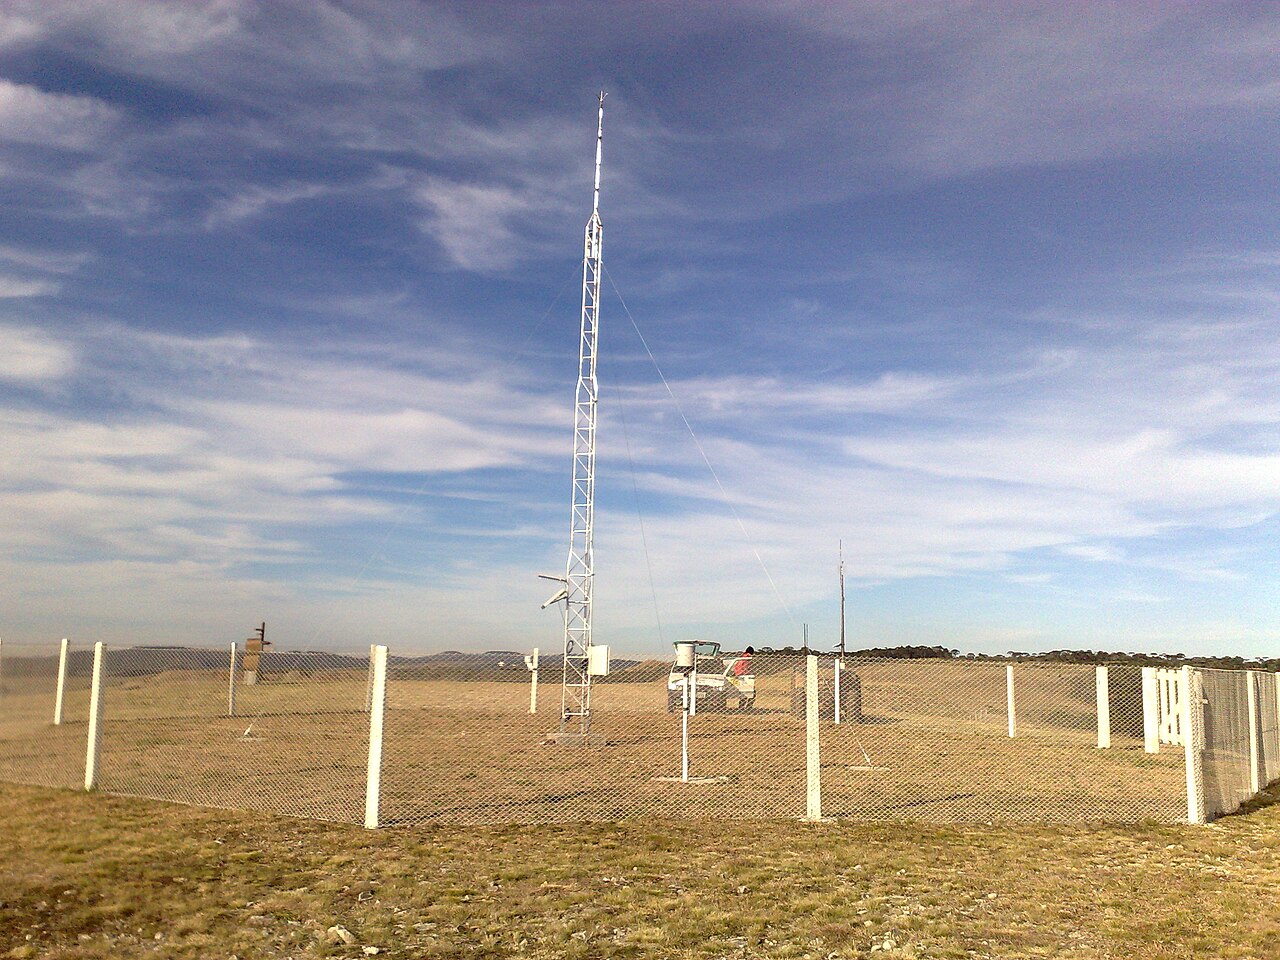
Typical equipment on which a DSS is based
From a Croatian elaboration for a hazelnut orchard (Donji Hrastovac, Municipality of Sunja), a realistic list of the agrometeorological station on which a DSS is built is visible:
| Component | Purpose |
|---|---|
| Central unit with GPRS module | data transmission |
| Leaf wetness sensor (PLWS) | assessment of fungal infection risk |
| Rain gauge (RG300) | precipitation, leaching, wetting |
| Air temperature and relative humidity sensor (RHT35) | frost, diseases, phenology |
| Soil moisture sensors (min. 2 units) | irrigation |
| Air temperature and wind speed sensor | frost, evapotranspiration |
| Photovoltaic module, stand, SIM/license | power supply and connection |
| Computer program + mobile app | overview and alerts |
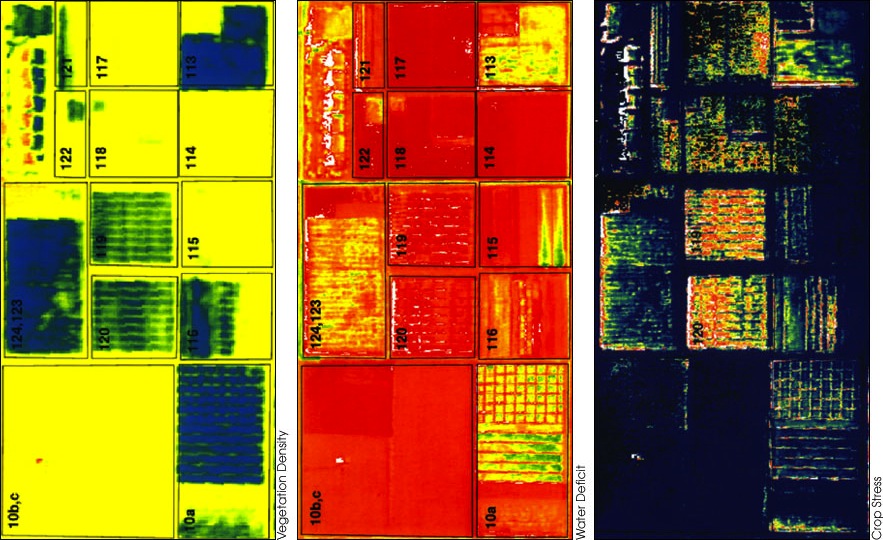
In PANTHEON, data from the station is transmitted via a LoRa module, and humidity, temperature, precipitation, and solar radiation are used to calculate VPD (vapor pressure deficit) and the crop water stress index (CWSI) — thereby distinguishing drought stress from stress caused by disease or pests.
Risk models for diseases and pests
The core of every DSS for plant protection is the risk model: a mathematical link between the amount of inoculum, environmental conditions, and disease development. As the literature states, such models are "key components of every decision support tool in plant protection" because they improve timeliness and effectiveness while reducing economic and environmental costs.
Powdery Mildew (mal bianco / Erysiphe-type)
Models for powdery mildew (Italian mal bianco), adapted from vineyard experience, calculate daily for each weather station:
- the dose of inoculum not yet dispersed,
- the rate of cleistothecia opening per event,
- the infective efficiency of each event,
- the moment of sporulation (appearance of symptoms),
- the seasonal epidemic pressure.
Practical benefit: instead of calendar-based spraying, fungicides are applied before the period of actual risk. This reduces the number of treatments and increases effectiveness.
EFB and Fruit Rot — DEFHAZ and "rotten incidence" model
Two prominent weather-driven models have been developed for hazelnut targeting defective/rotten nuts (associated with the Diaporthe spp. complex, including Diaporthe eres):
DEFHAZ is a mechanistic model that operates on hourly data from January 1st:
| Input | Threshold / Parameter |
|---|---|
| Air temperature | cardinal values for infection 14 °C (opt.), 6 °C (min.), 32 °C (max.) |
| Relative humidity / wetting | condition for infection and latency |
| Precipitation (spore dispersal) | > 0.2 mm |
| Pycnidia development | GDD ≥ 788 |
The model provides a cumulative infection index (Dh-I) and predicts the probability that the incidence of defective nuts will exceed 1 %, for both hidden (internal browning) and total defects, at stages BBCH81 (start of ripening) and BBCH89 (full maturity/harvest). Validation showed:
- ~95 % accuracy for hidden defects (BBCH81 vs. BBCH81),
- 71–89 % for total defects (BBCH89),
- 84 % (hidden) and 71 % (total) for advance prediction (BBCH81 → BBCH89).
Key value: risk prediction approximately one month before harvest, allowing targeted fungicide application during the sensitivity period (in literature until the end of May) and identification of "risky areas."
The related rotting simulation model (Valeriano et al., 2022, applied to seven main production municipalities in Turkey) links a process-based epidemiological module of the Diaporthe cycle with phenological fruit development. The number of hours suitable for conidia spread (CumCS) serves as a proxy measure of inoculum for the following year, and plant sensitivity (PS, 0–1) is activated when female flowers are receptive to spores. Practical message: the risk of rotting is not the same every year and depends on the weather of the previous season — the DSS quantifies this.
Curculio (Hazelnut Weevil) and Phenological Approach
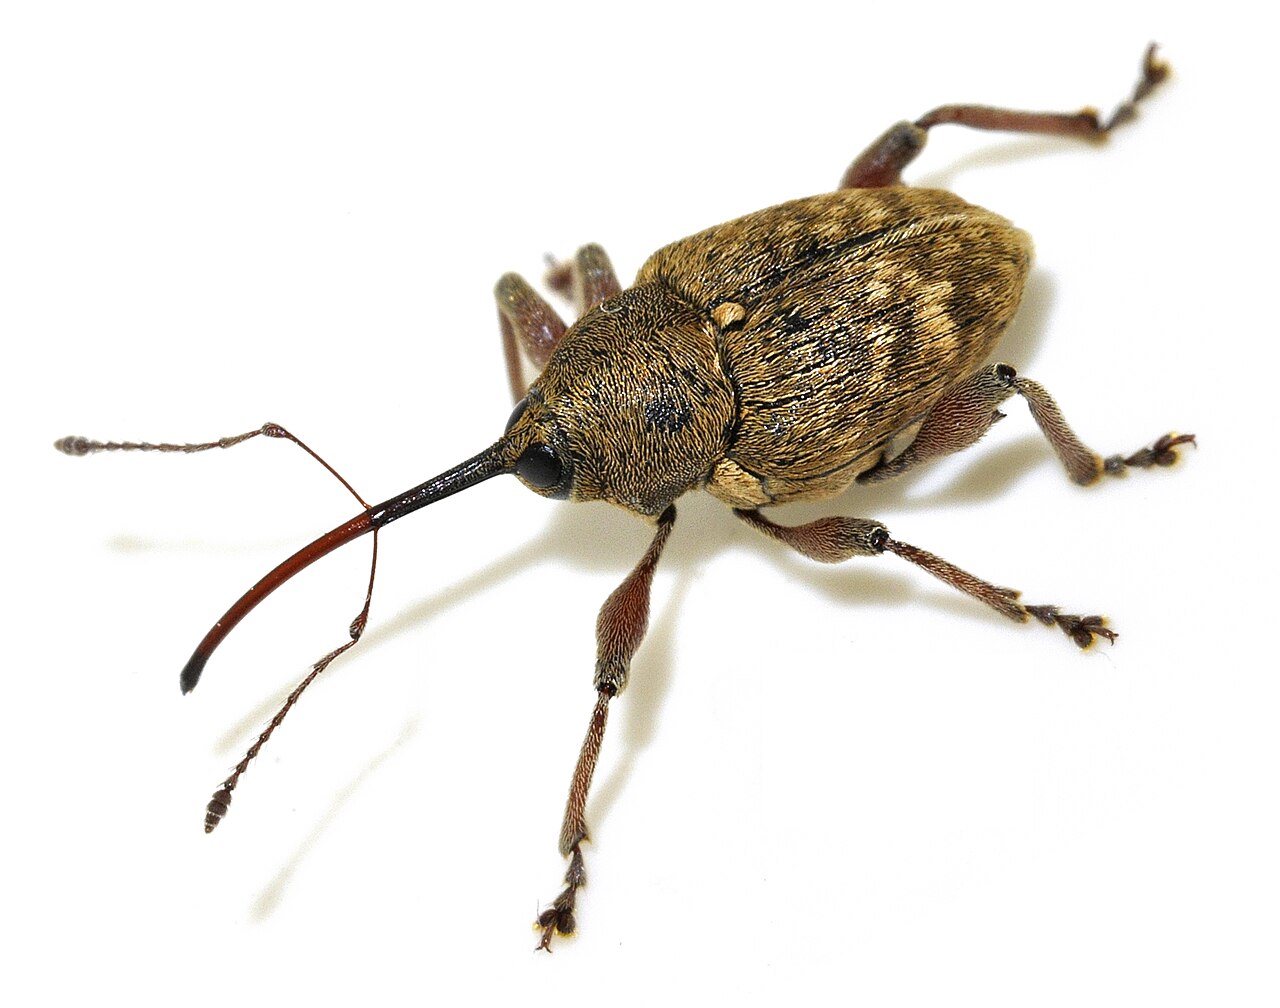
For Curculio nucum (hazelnut weevil), there is no equally standardized public model like for rotting, but the logic is the same and is based on phenology and temperature sums: the appearance of adults and the egg-laying period are linked to the phenological phase of fruit development and accumulated degree-days. A DSS that monitors phenology (see below) and trap catches helps determine the threshold and window for treatment, instead of routine spraying. In the absence of a validated model for local conditions, rely on trap monitoring and advisory services.
Dosages and products are informative
Risk models indicate when the risk is high — they do not prescribe the product or dosage. The choice of preparation, dosage, and withholding period depends on the cultivar, location, and current registration/label. Always check the approval status of the product in Croatia (FIS database) and consult an advisory service before application.
Phenological Models — Timing Everything Else
A phenological model estimates when individual phases (leafing, flowering, stigma receptivity, ripening) will occur based on air temperature and, increasingly, photoperiod.
This is the "backbone" of the entire DSS because disease models, treatment timing, and frost risk assessment all depend on the development phase.
- Models of the American Spring Index type (implemented e.g., in MATLAB) combine air temperature and photoperiod to estimate the "start of spring" (first leafing or first flowering). Estimates of phenological shifts under climate change directly affect protection and harvest planning.
- In the rotting model, eight female reproductive phases are simulated from flowering to fruit drop, and the season "starts" on October 1st as a reference date.
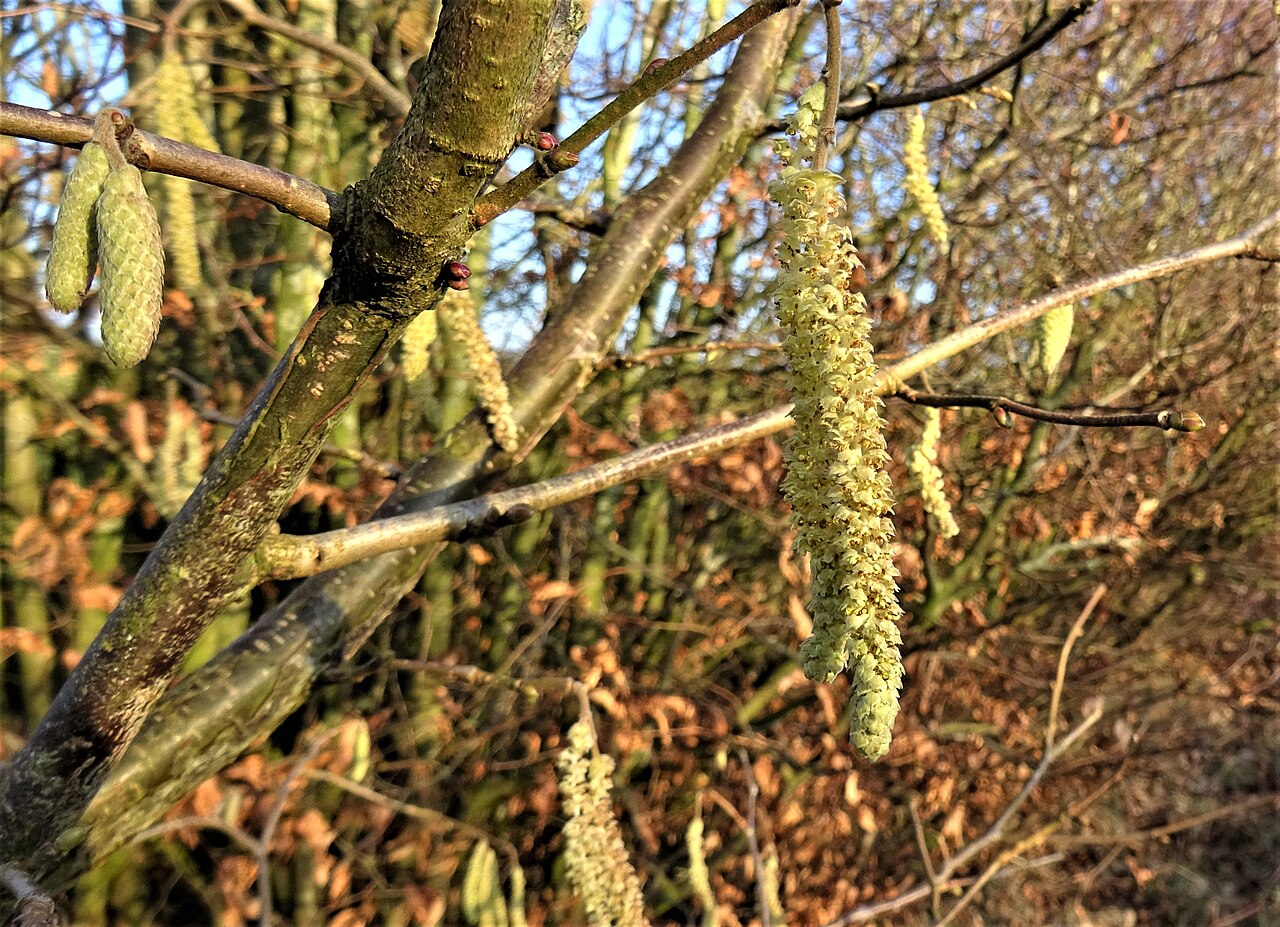
- Phenology determines the sensitivity window: e.g., stigma receptivity (phase R8 full flowering → R9 withered stigma) is crucial for both pollination and the entry of fungal spores.
Practical: if the DSS knows the orchard is in the stigma receptivity phase, then both the frost warning and the infection warning carry more weight, and recommendations can be prioritized.
Frost Alarms
Spring frost is one of the biggest risks for hazelnut, which blooms very early. Here, the DSS has a dual role: forecast (risk for a few days in advance) and real-time alarm (temperature drops below critical).
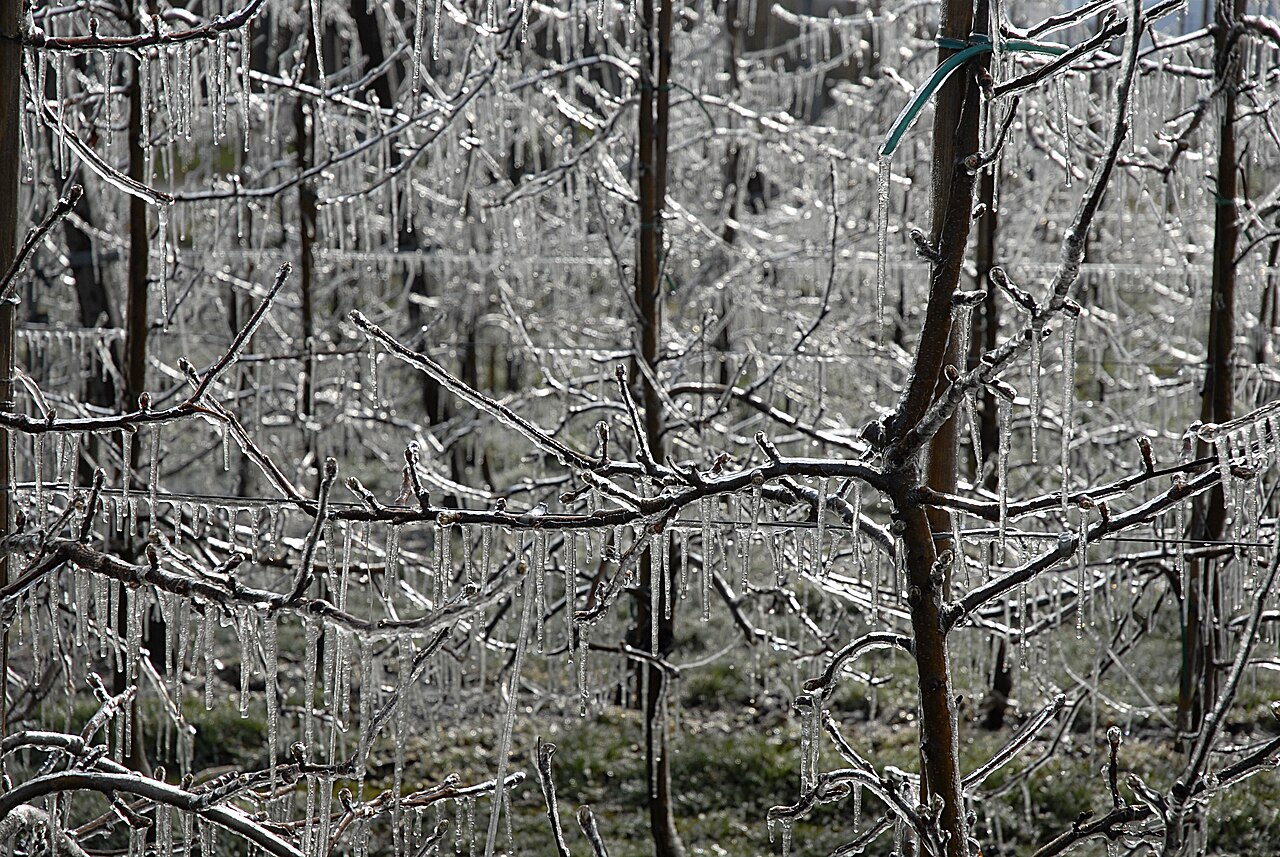
From Slovenian technological guidelines, the limitation of general forecasts is clear: the national meteorological service warns of danger, but "cannot accurately predict when and how much the temperature will drop below zero in a specific orchard." Therefore, it is recommended:
- micro-meteorological forecasts for risky positions (linking weather situations with relief),
- upgrading agrometeorological stations with dry and wet bulb sensors at 0.5 m height,
- SMS alerting interested growers (modeled on the system in South Tyrol).
Classic literature on frost protection (Snyder/Connell) adds practical elements of alarm systems:
- reliable electronic alarms that ring on the phone, trigger a wind machine or pump when an unexpected cold front enters,
- a sensor in a standard thermometer shelter, calibrated against a network of thermometers distributed across plots,
- alarm thresholds set according to critical bud temperatures (which depend on the phenophase).
For active protection, if the DSS triggers irrigation for "frost" (sprinkling), the approximate consumption is ~2.5–5.1 mm/h of water; dynamic methods like Frostbusters (tractor-mounted hot air blower, ~80–100 °C, return to starting point within ~10 min) require calm air. All these figures are informative and depend on the orchard and equipment.
| DSS Function for Frost | What it Provides to the Grower |
|---|---|
| Risk Forecast (several days) | equipment preparation, fuel, shift scheduling |
| Real-time Alarm (critical temp.) | immediate signal to activate protection |
| Automatic Activation (valve/pump/wind machine) | reaction even without staff on site |
| Calibration according to Phenophase | more accurate thresholds (critical bud temp.) |
| ## Model-based irrigation |
The DSS concept for irrigation is decades old, and today it relies on the water balance model (ET-WB) and/or soil moisture sensors. The goal is "restitution" — returning exactly the amount of water the orchard has consumed, thereby saving water and avoiding stress.
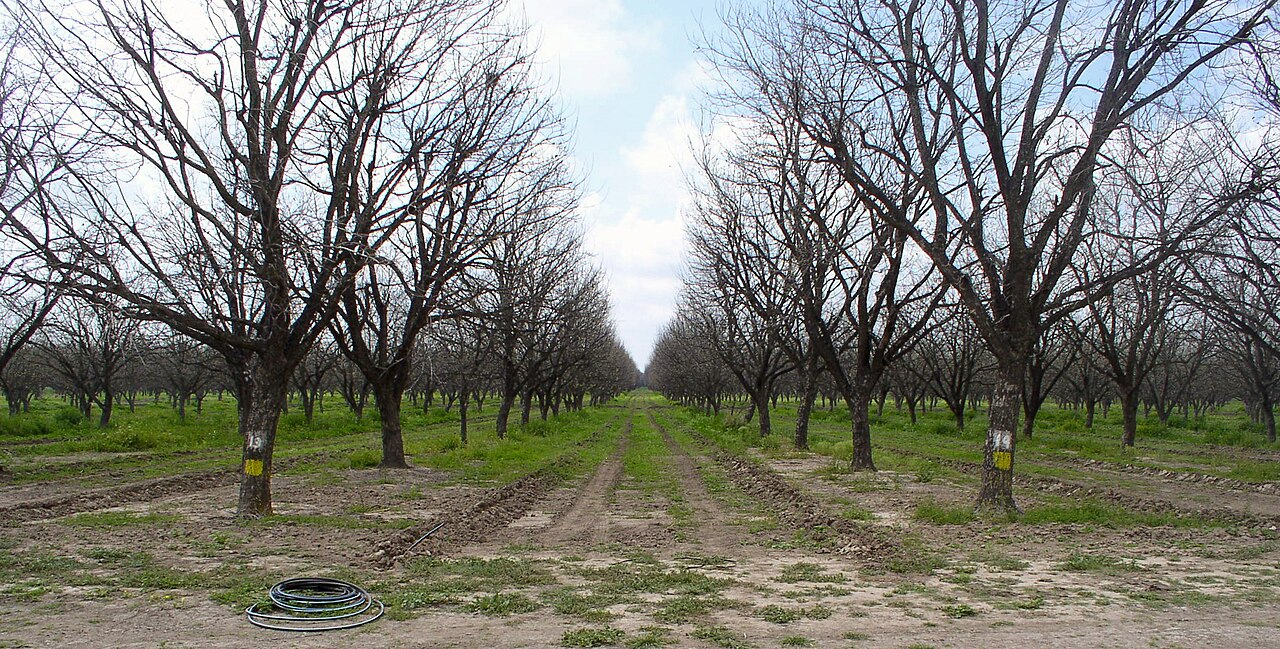
- Water balance / ETo: forecasted reference evapotranspiration and precipitation are input into models; known frameworks include AquaCrop, DSSAT, WOFOST, APSIM.
- Sensor-based approach: soil moisture sensors (minimum 2 units in the elaboration) and CWSI/VPD calculations from the weather station (PANTHEON) provide direct feedback for valve management.
- Orientative figures for hazelnut: promotional and technical sources cite approximate seasonal needs of ~800 mm for common hazelnut and the application of self-compensating drippers due to terrain slope (e.g., ~1666 m of drip line/ha); irrigation can reduce the proportion of empty shells (cited at ~20 %). In Turkish trials with subsurface drip irrigation (drippers spaced at 40 cm, flow rate 2 L/h, at 15 cm depth), regimes of 70 %, 100 %, and rain-fed (control) needs were compared — this is precisely the type of decision the DSS helps make.
| Approach | Main Input | Output / Decision |
|---|---|---|
| Water balance (ET-WB) | ETo, precipitation, phenological stage, soil type | quantity and timing of irrigation |
| Soil moisture sensors | moisture in the root zone | when to irrigate (thresholds) |
| CWSI / VPD (canopy) | temperature, humidity, radiation | distinguishing drought from disease |
Figures are indicative
The stated quantities (mm/ha, dripper spacing, percentages) depend on cultivar, soil, climate, and system, and serve only as order-of-magnitude estimates. Confirm local irrigation norms through measurements and advisory services.
The bridge between sensor technology and agronomy
Sensor technology (IoT, remote sensing) alone provides only numbers; agronomy requires a decision. The DSS is the layer that connects them:
- Data layer — weather station, soil/leaf sensors, satellites/drones (PANTHEON uses both aerial and ground robots).
- Model layer — phenology, disease models (powdery mildew, DEFHAZ/rot), water balance, frost.
- Decision layer — risk index, alert, recommended window; a proposal that the human confirms.
- Action layer — manual work or automatic control (irrigation, anti-frost protection).
It is precisely this chain logic that increases the detection of limiting factors "for each individual plant" (water shortage, pests, diseases) and enables timely reaction — with higher production, lower costs, and reduced environmental impact.
Practical recommendations and common mistakes
Recommendations
- Start with one well-placed weather station equipped with a leaf wetness sensor and temperature sensor; it covers diseases, frost, and phenology.
- Insist on SMS/push alarms for frost — a forecast without real-time alarms is insufficient.
- Calibrate sensors and thresholds according to your own thermometer network and critical bud temperatures by phenological stage.
- Use disease risk models to reduce the number of treatments, rather than blindly spraying according to a calendar.
- Treat the DSS recommendation as a proposal you confirm with field observations (traps, inspections).
Common mistakes
- Relying on general regional forecasts instead of the orchard's micro-location (relief and frost pockets significantly alter the picture).
- Placing the station in a non-representative position (not in the risky, frost-prone zone).
- Confusing drought stress with disease stress — without VPD/CWSI or leaf sensors, errors are easy to make.
- Applying doses and products "from an article" without checking registration and labeling for Croatia.
- Neglecting phenology: the same meteorological conditions carry different risks depending on the development stage.
Gallery
Sources
This article is an AI summary from an internal literature collection on hazelnut (RAG corpus) and public sources. Main sources used:
- Smart Agriculture: Nuove Tecnologie Informatiche in Agrometeorologia e Agronomia (Parisi, 2024.) — RAG corpus (definition and role of DSS).
- Precision Farming of Hazelnut Orchards (PANTHEON) — SCADA for Agriculture / PANTHEON: SCADA for Precision Agriculture — RAG corpus and CORDIS, project 774571; CORDIS Results in Brief
- DEFHAZ: A Mechanistic Weather-Driven Predictive Model for Diaporthe eres Infection and Defective Hazelnut Outbreaks — PMC9784339
- Valeriano et al. (2022.) Rotten Hazelnuts Prediction via Simulation Modeling — A Case Study on the Turkish Hazelnut Sector — RAG corpus and PMC9014268; doi:10.3389/fpls.2022.766493
- Fungal trunk diseases of fruit trees in Europe (2022.) — RAG corpus (role of models in DSS for plant protection).
- Studio di differenti strategie... / model for mal bianco (powdery mildew) — RAG corpus.
- Tehnološka navodila za zaščito pred spomladansko pozebo v sadjarstvu (2018.) — RAG corpus (micrometeorology, SMS alarms).
- Frost Protection in Orchards and Vineyards (Snyder/Connell) — RAG corpus (alarms, calibration, critical bud temperatures).
- Elaborat zaštite okoliša... nasad lijeske, Donji Hrastovac, Općina Sunja (2021.) — RAG corpus (composition of the agrometeorological station).
- IRRITEC — irrigation of the common hazel and Farklı Sulama Yönetimleri (fındık) (2022.) — RAG corpus (indicative irrigation figures).
- Assessment of potential shifts in hazelnut phenology (2025.) and American Spring Index methodology — RAG corpus (phenological models).
- Reviews of DSS for irrigation and frost-prediction systems: Survey on Smart Irrigation Scheduling (PMC9083007); Machine Learning-Based Hourly Frost-Prediction System for Orchards (MDPI Atmosphere 12/846)