Data-driven decision-making and Key Performance Indicators (KPIs)
Content generated by artificial intelligence — verify before application
This article was automatically compiled from a collection of hazelnut literature using artificial intelligence and may contain errors or outdated data. It serves as a starting point for further research, not as professional advice. Dosages, products, and timing are informative and depend on the cultivar, location, and applicable regulations — always verify with advisory services and official sources before application.
Hazelnut cultivation is a long-term investment where full bearing is expected in five to eight years, and the orchard remains in production for several decades. In such a timeframe, a "gut feeling" about whether the farm is doing well or poorly is simply not enough. The difference between a profitable and barely surviving orchard often lies in a few dozen cents per kilogram of cost or in a few hundred kilograms of yield per hectare — and these differences are only visible when measured systematically. This article explains how to define Key Performance Indicators (KPIs) for a hazelnut farm, how to collect the data that feeds them, and how to turn these numbers into better decisions.
What is a KPI and why specifically for hazelnuts
A Key Performance Indicator (KPI) is a measurable quantity that shows how well a farm is achieving its objectives. In agricultural economics literature, business performance indicators are defined as the ratio of results to inputs and serve as a measure of adherence to the principles of rational business management. A key characteristic is that accounting figures are reduced to relative numbers — making them comparable across years, plots, cultivars, and even between different farms regardless of their size.
KPIs are particularly useful for hazelnuts for three reasons:
- Long production cycle — decisions you make today (cultivar, planting density, irrigation system) are paid for or charged over the next 30+ years. Without data from previous seasons, these decisions remain guesswork.
- High dependence on weather and alternate bearing (alternation) — yield varies greatly from year to year, so a single season tells little. Only multi-year trends of indicators reveal the true state of affairs.
- High share of fixed costs — the orchard, machinery, and drying facilities are expensive and must be paid for regardless of the crop. This means profitability is built by increasing volume and lowering cost per kilogram, which are precisely the magnitudes tracked by KPIs.
Three fundamental KPIs for a hazelnut farm
Although dozens of indicators can be tracked, three are the main drivers of the story for any horticultural farm: yield per hectare, cost per kilogram, and margin. They answer three basic questions: how much am I producing, how much does it cost me, and how much is left for me.
1. Yield per hectare (kg/ha)
Yield per hectare is the most direct measure of land productivity and agrotechnical efficiency. It is calculated simply:
Yield (kg/ha) = total harvested and dried nuts (kg) ÷ bearing area (ha)
It is important to distinguish between raw (wet) yield at harvest and yield after drying and cleaning, as hazelnuts are sold and compared on a dry mass basis. Measure the one relevant for sales and always consistently — otherwise, the indicator is not comparable across years.
Yield strongly depends on orchard age, cultivar, and planting density. Literature from the corpus provides a range of values that can serve as a rough reference (all figures are informative and depend on location, cultivar, and technology):
| Source / context | Yield (kg/ha) | Note |
|---|---|---|
| Calculation catalog (continental Croatia) | 700 | conservative calculation for cost coverage |
| Investment projections (3rd year of full bearing) | 2,000 | at a price of ~20 kn/kg → 40,000 kn/ha revenue |
| Elaborate (estimated full crop) | 2,500–3,600 | t/ha for mature orchard |
| Dense layout 4.5×4.5 m (8th year) | ~1,870 | impact of density on early bearing |
| Intensive orchards (Chile, top conditions) | 8,500–12,000 | upper potential of cultivar and location |
Lesson: there is no single "hazelnut yield" number. Your goal is not to guess someone else's number but to track your own trend and compare it with comparable orchards (same cultivar, similar spacing and age).
2. Cost per kilogram (kn/kg or €/kg)
Cost per kilogram is an indicator that links the cost side with quantity. It is a magnitude that buyers, purchasers, and competitors do not see, but which determines whether you will survive poor market years.
Cost/kg = total production costs (kn) ÷ harvested quantity (kg)
For the indicator to be useful, costs should be divided into variable (increase with production: fertilization, protection, harvest, drying, packaging) and fixed (orchard, machinery depreciation, interest, land). Analysis of hazelnut harvest costs in the literature explicitly separates operational cost into variable and fixed components, and the average cost per hectare is obtained by multiplying cost per kilogram by yield per hectare — showing how intertwined these two magnitudes are.
From the corpus, an illustrative structure of variable costs for 1 ha in continental conditions can be assembled (figures are informative, from older calculations in kunas):
| Cost item | Amount (kn/ha) |
|---|---|
| Mineral fertilizer | ~1,360 |
| Protection | ~3,218 |
| Harvest | ~5,714 |
| Pruning | ~1,800 |
| Drying and other | ~1,000 |
| Own machinery | ~2,463 |
| Replanting / packaging | ~250 |
| Total variable cost | ~15,806 |
With a yield of 2,000 kg/ha, this gives a variable cost of about 7.9 kn/kg; only when you add fixed costs and orchard depreciation do you get the true break-even point. The most important lesson from the cost structure is that harvest and protection are the largest individual items — so the greatest effects on cost/kg are achieved precisely by optimizing them (harvest mechanization, targeted protection based on pest thresholds).
Cost per kilogram decreases as yield increases, because fixed costs are spread over more kilograms. Therefore, managing high fixed costs is essentially a race for volume: the larger and more uniform the crop, the lower the cost per kilogram.
3. Margin and economic indicators
Margin shows how much is left for you after costs. In practice, two levels are tracked:
- Gross margin (coverage of variable costs, CVC) = revenue − variable costs. This is the most useful indicator for daily and seasonal decisions because it isolates what you can influence in the short term. Literature emphasizes that the calculation of variable cost coverage is a good basis for "short-term and quick decisions" regarding production planning and investments.
- Net margin (net profit) = revenue − all costs (including fixed and depreciation). It measures true long-term profitability.
In addition to margin, Croatian agricultural economics uses two classic relative indicators:
| Indicator | Formula | Interpretation |
|---|---|---|
| Economic efficiency (business profitability) | total revenues ÷ total expenses | > 1 efficient; = 1 at the limit; < 1 inefficient |
| Profitability | profit ÷ invested capital (or revenue) | return on investment |
| Net profit margin | net profit ÷ revenue | share of profit in each kuna of revenue |
Concrete example from the corpus: a projection with revenue of 40,000 kn/ha and expenses of 33,394 kn/ha gives an economic efficiency coefficient of 1.20 — the business is efficient, and further growth is expected as the orchard enters full bearing. Another example (yield 2,000 kg/ha, price 11 kn/kg, revenue 22,000 kn/ha) with variable costs of 15,806 kn/ha gives a profit of about 6,193 kn/ha.
Extended set of indicators
The three fundamental KPIs form the core, but a more mature monitoring system adds indicators that explain why the numbers are what they are:
- Revenue per hectare (kn/ha) — primary measure of land profitability; shows how effectively you convert cultivated area into sales.
- Utilization (drop / percentage of grade A sales) — share of nuts that pass the quality grade; directly affects the realized price.
- Share of subsidies in revenue — how much the business depends on subsidies (important for risk assessment).
- Harvest cost per kilogram — tracked separately because it is the largest individual item.
- Water / fertilizer consumption per kilogram of nut — indicators of resource efficiency; increasingly important for sustainability and CAP requirements.
- Technical efficiency — advanced indicator from econometric studies (Data Envelopment Analysis, DEA) that compares your orchard with "best practice." Studies on hazelnuts show that sucker control is one of the most important positive factors for economic efficiency, along with education and access to credit.
Illustrative data on improvement potential: in the FADN system, an efficiency score of 0.3 means that the average farmer could achieve the same result with 70% less input using existing technology. This shows how much room for progress is revealed only by measurement.
From Data to Decisions: A Practical Cycle
Indicators are only valuable if they lead to action. A useful framework is the plan → do → check → act cycle (Deming cycle), adapted for horticulture:
- Plan — set target KPI values for the season (e.g., yield 2,000 kg/ha, cost < 8 kn/kg, economic efficiency > 1.15).
- Do — implement agrotechnical practices with consistent recording (standard operating procedures, sprayer calibration, record of every operation).
- Check (Control) — continuously monitor indicators: yield per plot, costs by item, soil and plant moisture, phenological stages.
- Act (Improve) — based on deviations from the plan, design corrective and preventive measures and update the technology; the farm thus becomes a "learning organization."
What Data to Collect
The quality of decisions is never better than the quality of the data. The minimum dataset for a hazelnut orchard:
| Category | What to Record | Frequency |
|---|---|---|
| Production | yield per plot (wet and dry), quality class | every harvest |
| Costs | labor hours, fuel, fertilizers, crop protection products, services, packaging | per operation |
| Agrotechnics | dates and doses of fertilization/protection, pruning, shoot trimming | per intervention |
| Environment | precipitation, temperatures, soil moisture, phenological stages | daily/weekly |
| Market | purchase prices, contracts, sales channels | per sale |
| Resources | water and energy consumption | monthly/seasonal |
Recording per plot (or block), rather than just for the entire orchard, is what enables real decision-making: only then do you see which plot, cultivar, or growing system is lagging and why.
Tools: From Notebook to Sensors
You don't need expensive software immediately. Many orchards start with a neat spreadsheet per plot and season — and that is already a huge step forward. Next levels include:
- Farm Management Software (FMS) for recording operations, costs, and inventory.
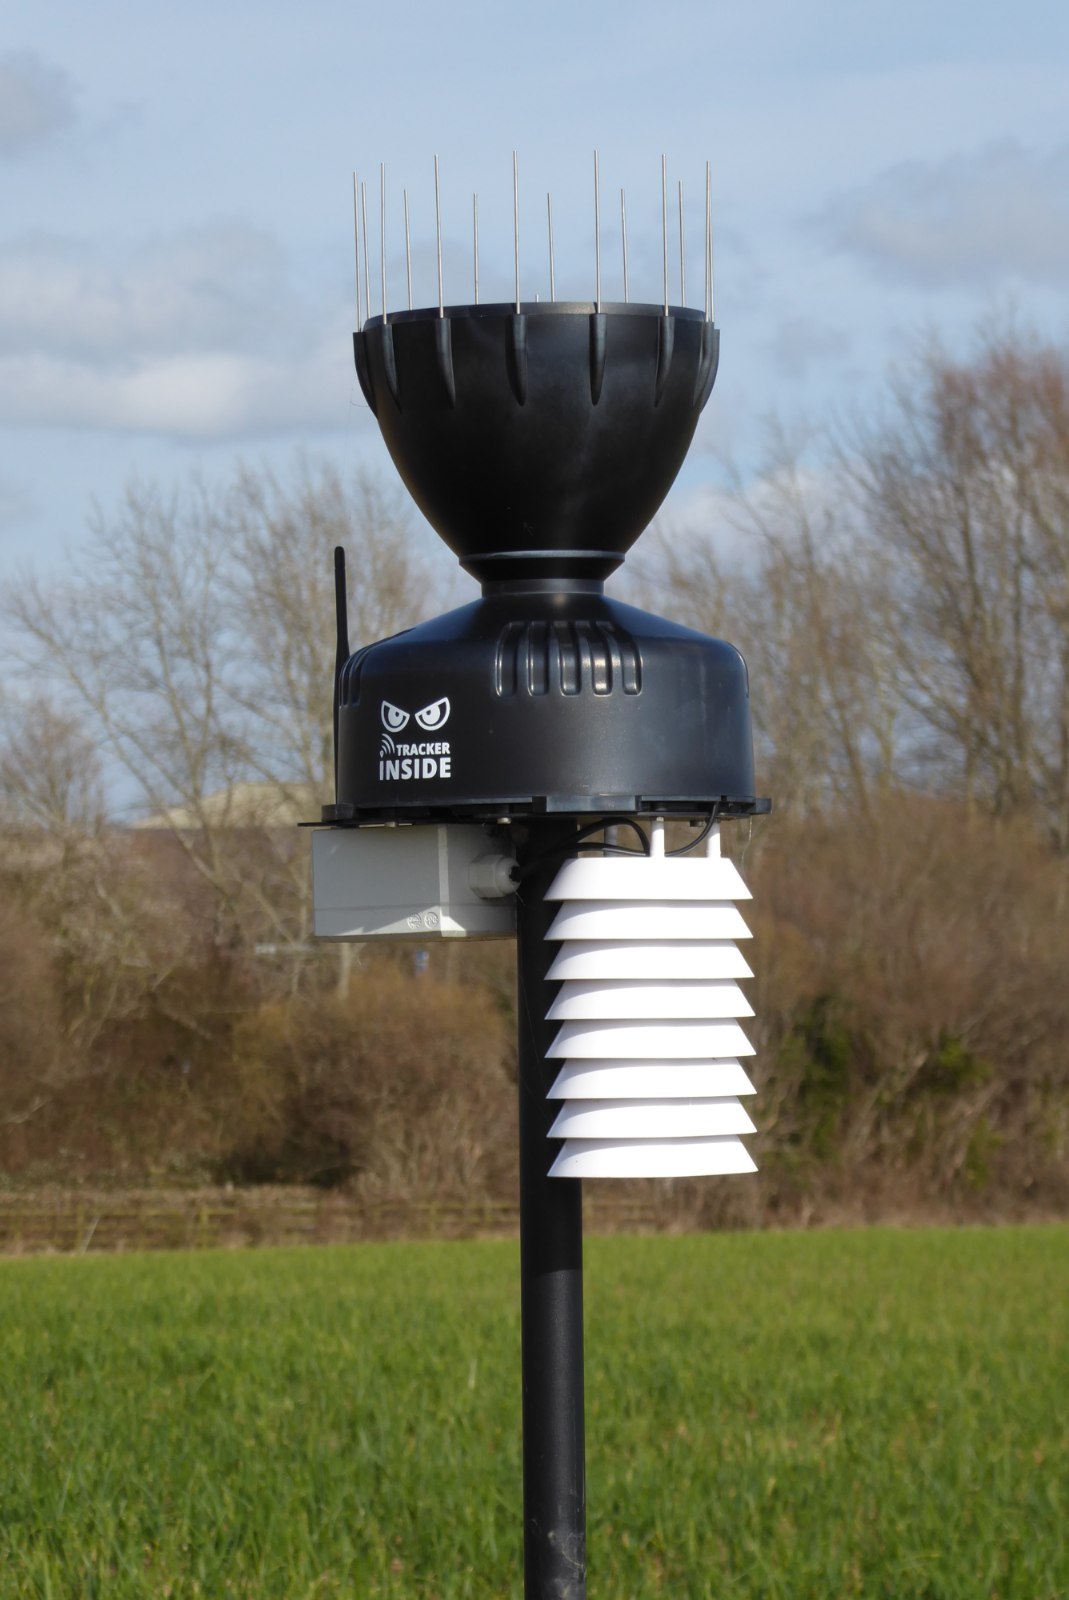
- Soil moisture sensors and weather stations for irrigation decisions; advanced micro-tensiometers allow continuous measurement of plant water potential.
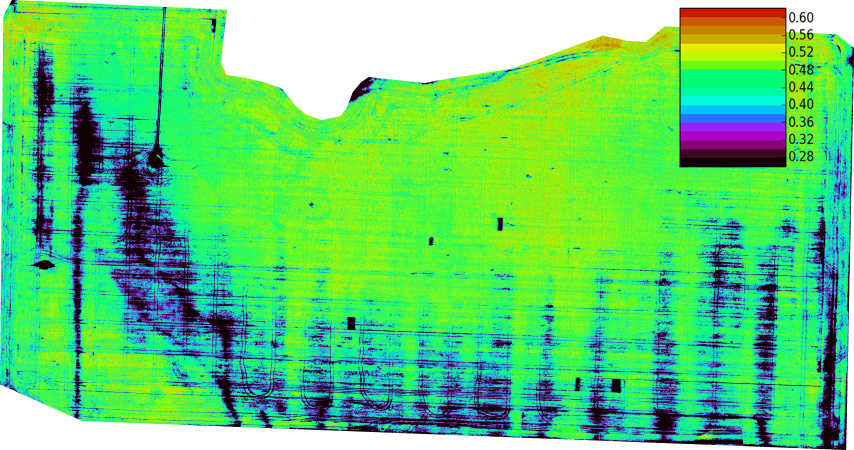
- Remote sensing (drones, satellites) and vegetation indices (NDVI, GNDVI, NDRE) for monitoring orchard vitality and early problem detection.
- Precision agriculture (PANTHEON hazelnut project) where algorithms compare automated pruning and irrigation decisions with those a specialist would make.
Technology is a means, not an end — start with the question "which decision do I want to improve?", and only then choose the tool that provides the data for that decision.
Benchmarking: Comparison as a Tool
A single number means little without context. The value of a KPI comes from comparison:
- With your own history — most reliable; eliminates differences in location and cultivar. Track three-year moving averages to smooth out alternate bearing.
- With comparable orchards — same cultivar, similar spacing and age, similar climate.
- With reference calculations — e.g., agricultural production cost catalogs, FADN data, professional associations.
Be cautious with external figures: the range of hazelnut yields from 700 to 12,000 kg/ha in literature shows how varied conditions can be. Comparison only makes sense within comparable categories.
Common Mistakes
- Measuring only at the orchard level, not per plot — averages hide both the best and the worst plots.
- Confusing wet and dry yield — makes years incomparable and overestimates production.
- Ignoring fixed costs and orchard depreciation — gross margin looks good, but the orchard loses money in the long run.
- Decisions based on a single season — alternate bearing and temporal variability require a multi-year perspective.
- Collecting data that is never analyzed — recording without calculating indicators is wasted time; perform a concluding analysis at least once a year.
- Overlooking "hidden" cost levers — shoot control, harvest optimization, and targeted protection have a disproportionate impact on efficiency.
Practical Recommendations
- Start simple: a table with yield, costs, and calculation of three fundamental KPIs per plot.
- Standardize measurement (always dry mass, same unit, same cost categories) so numbers are comparable.
- Set realistic target values and revise them annually based on your own trend.
- Analyze the largest cost items (harvest, protection) — this is where the greatest potential for cost reduction per kg exists.
- Build a multi-year series; three to five seasons provide a reliable picture.
- Add technology gradually, guided by the specific decision you want to improve.
Sources
This article is an AI summary compiled from a collection of hazelnut literature (internal RAG corpus) and publicly available sources. Main sources used:
- Investment study for the production of innovative hazelnut-based products (Corylus avellana L.) — business success indicators, economic efficiency, profitability, net margin (RAG corpus)
- Economic viability of hazelnut production — yield, price, economic efficiency coefficient — scholar.google.com
- Catalog of agricultural production calculations 2019 — variable cost coverage calculations (VCC), gross margin (RAG corpus)
- Economic comparison of different hazelnut growing system forms — cost and profit structure per hectare (RAG corpus)
- Kilic et al. (2009), Determinants of economic efficiency: hazelnut farms — doi.org/10.1080/01140670909510272
- Guliyev et al. (2019), Determinants of technical efficiency of hazelnut production — doi.org/10.3390/su11164332
- The assessment of hazelnut mechanical harvesting productivity — harvest cost analysis (variable/fixed, cost/kg) (RAG corpus)
- Agriculture Strategy to 2030 — FADN, efficiency results, total factor productivity (RAG corpus)
- Precision Farming of Hazelnut Orchards (PANTHEON) — automated decision-making, validation measures (RAG corpus)
- Sürdürülebilir Tarım için Yenilikçi Mekanizasyon Yaklaşımları — Deming cycle, EnPI, monitoring and measurement (RAG corpus)
- 7 Fruit Farming KPIs: Yield, Margin, and Land Efficiency — financialmodelslab.com
- Crop Yield Per Hectare KPI in Agriculture — analytics-model.com
- Agriculture & Farm Key Performance Indicators (KPI) — performyard.com
- What Is Gross Profit, and Why Is It Important in Agriculture? — ambrook.com
- The Power of Data-Driven Decision Making in Farm Management — bivatec.com