Business Plan and Risk Management in Hazelnut Cultivation
Research-grounded draft (sources cited) — adapt to local context
Article adapted to the United States (Oregon), based on Croatian/EU research literature (see Sources). Figures come from the cited studies and are indicative for the United States (Oregon): verify local equivalents with USDA, FSA, state Departments of Agriculture (e.g. Oregon), OSU Extension, Oregon Hazelnut Commission.
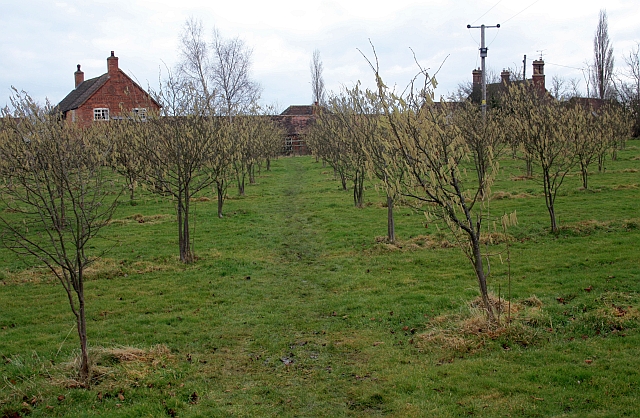
Establishing a hazelnut orchard is a long-term investment in a permanent crop that reaches full bearing only after several years and remains productive for decades. Because of this time lag between investment and significant revenue, a quality business plan is not a bureaucratic formality but a survival tool. It links agronomic assumptions (planting density, varieties, yields) with financial consequences (cash flow, return on investment) and forces the producer to consider risks that could destroy an otherwise good idea. This article guides you through creating a business plan, setting realistic yield and price assumptions, projecting cash flow, conducting sensitivity analysis, and systematically managing production and market risks.
What is the Purpose of a Business Plan in Hazelnut Orchards
A business plan is a written document describing an entrepreneurial venture, its goals, market, and financial sustainability. For a hazelnut orchard, it typically includes:
- Executive Summary — investor, location, area, goal (e.g., growth and development of agricultural production for hazelnut cultivation).
- Market Analysis — product, price, distribution, promotion; characteristics of the sales and procurement market.
- Technological-Technical Assumptions — soil (pH 5.5–7.5, good humus supply and water-air relations), varieties, planting density, mechanization, irrigation.
- Investment Costs — in fixed assets (soil preparation, seedlings, irrigation systems, machinery) and working capital (for the first years).
- Financial Projections — income statement, cash flow projection, economic flow, profitability and efficiency indicators.
- Sensitivity Analysis and Risk Assessment.
From the literature, an example of a Croatian business plan (hazelnut seedling production, Osijek-Baranja County, 2019) notes the investment structure: total investments of approximately 792,795 HRK, of which fixed asset investments were 517,000 HRK (79.91%) and working capital investments were 130,000 HRK, funded mostly by own funds (702,795 HRK) with a smaller loan (80,000 HRK) [3]. Although these amounts are in Croatian Kuna and relate to a nursery, the structure (fixed + working capital, own + borrowed) is applicable to any orchard. Note: These figures are from Croatian/EU data; verify the United States/Oregon equivalent for local planning.
Note on Amounts
All monetary amounts in this article are taken from literature of various years (partly in Kuna, partly in Euros). They serve as an illustration of order of magnitude and structure, not as a current price list. For your own plan, use current prices for seedlings, machinery, consumables, and hazelnut procurement prices.
Yield and Price Assumptions
Financial projection stands or falls on two input assumptions: how much you will produce and at what price you will sell. Both should be set conservatively.
Yield Dynamics by Year
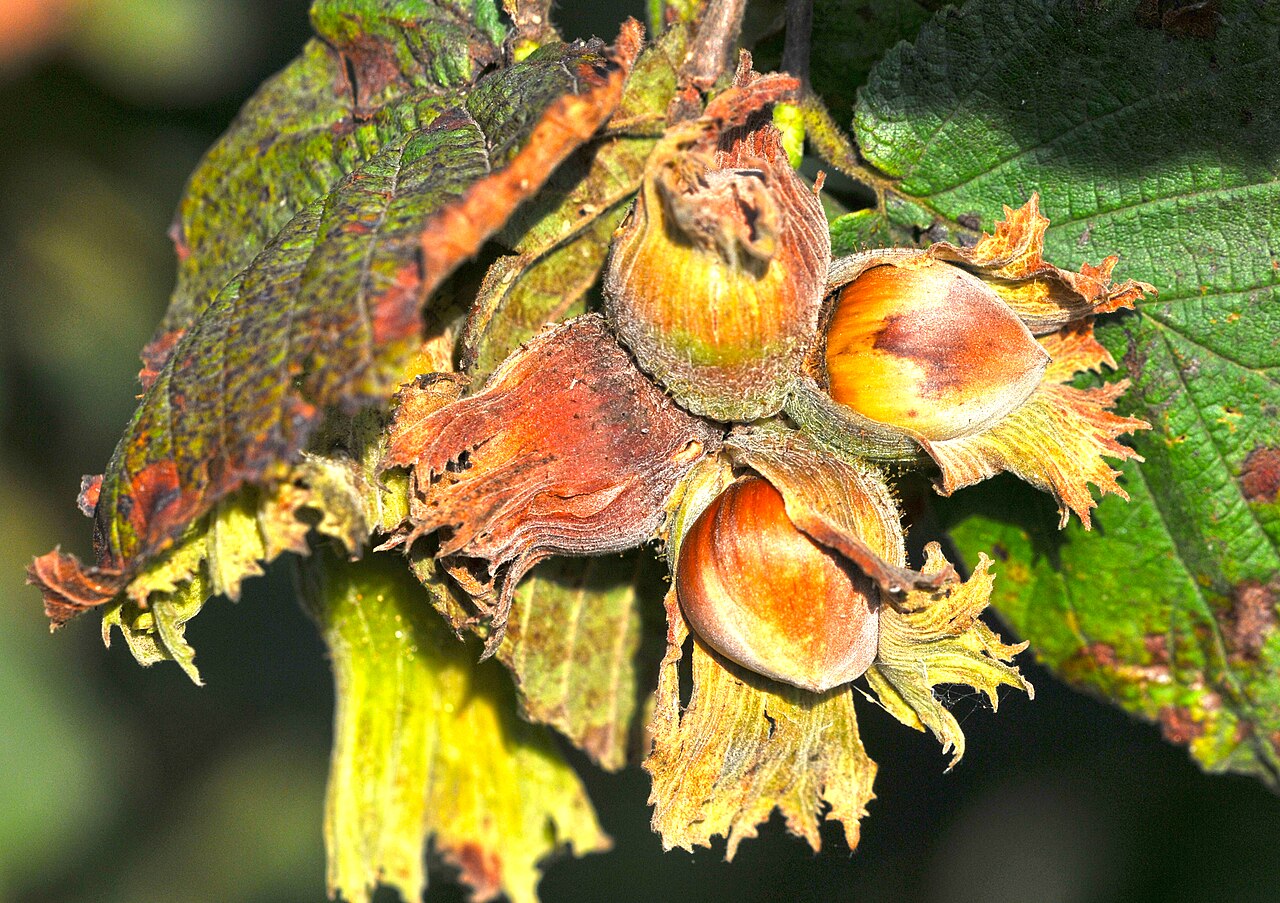
Hazelnuts do not bear immediately. Commercial yields usually begin around year 3–4, and full bearing is reached only after a decade. Literature on cultivation in Oregon provides an approximate curve for entering bearing (converted informatively, depending on variety, layout, and location):
| Year after planting | Approximate Yield (lb/acre, Oregon) | Approximate (kg/ha) |
|---|---|---|
| 3. | 75 | ~85 |
| 4. | 285 | ~320 |
| 5. | 440 | ~495 |
| 6. | 600 | ~675 |
| 7. | 1,100 | ~1,235 |
| 8. | 1,200 | ~1,345 |
| 9. | 1,600 | ~1,795 |
| 10. | 2,000 | ~2,240 |
| 11. | 2,300 | ~2,580 |
| 12.+ (full bearing) | 3,200 | ~3,590 |
Croatian sources confirm the order of magnitude for full bearing: existing orchards in full bearing yield about 2.5 tons of dry hazelnuts/ha, with possible increases to 3–3.5 t/ha with irrigation and good agronomy, and literature mentions possible yields up to 4 t/ha in optimal conditions. Calculations from continental Croatia calculate with about 2,000 kg/ha as a working assumption for a mature orchard. Note: These yield figures are from Croatian/EU data; verify the United States/Oregon equivalent for local planning.
Planting density directly affects the dynamics of return. By moving from 500 to 800 plants/ha, one producer in the Orahovica area shortened the expected return on investment from 9 to 7 years, because denser layouts fill space earlier and provide higher yield per hectare in early years [4].
Price Assumption
Price is the second key parameter. Examples from the corpus:
| Source / Year | Price | Note |
|---|---|---|
| Continental calculation (2015) | 11.00 kn/kg | in shell, working assumption |
| Economic analysis (2021/2023) | 1.99 EUR/kg | selling price in calculation per ha |
With price, always include subsidies/grants, which in some calculations make up a large part of revenue. In an example calculation for 1 ha from 2021: sales 1,200 kg × 1.99 EUR = 2,389.94 EUR, subsidy 1,061.78 EUR, total revenue 3,451.72 EUR with costs 2,588.04 EUR and net profit 863.68 EUR (profitability ~33.4%). Note: These price and subsidy figures are from Croatian/EU data; verify the United States/Oregon equivalent for local planning.
Rule of Caution for Assumptions
Plan with the lower range of yields and prices, and the upper range of costs. If the project is sustainable under pessimistic assumptions, it is more resilient to reality. Present optimistic scenarios separately, not as the base case.
Cash Flow Projection
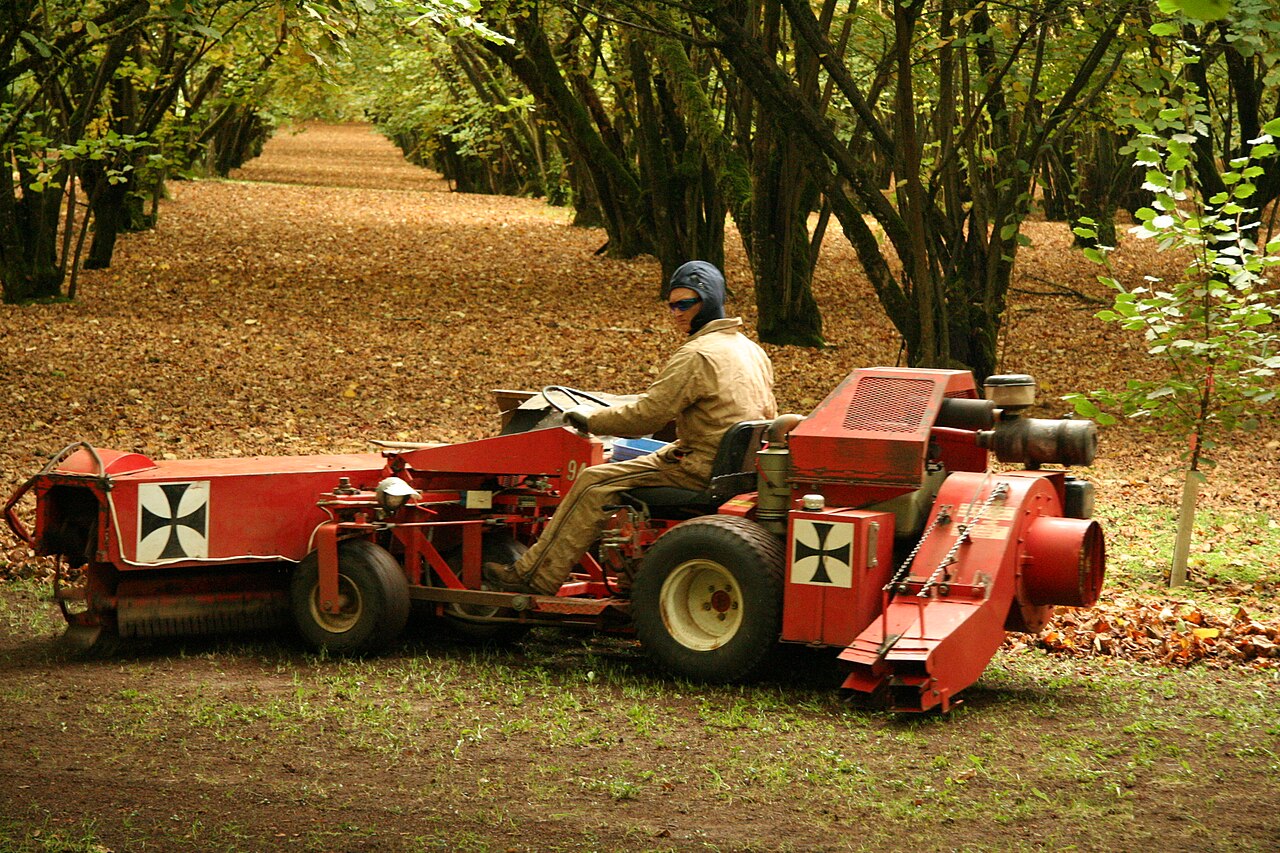
Cash flow is the central financial report of the business plan. Unlike the income statement which tracks accounting profit, cash flow tracks actual cash inflows and outflows — and it is lack of cash, not lack of profit, that most often knocks down young orchards.
As literature states: "Money is the basic resource for the sustainability of both reproductive and business processes. The cash flow report allows management to assess the success of money management as well as assess future cash flows so that the current account is not blocked." Practically, a quarterly or monthly presentation is recommended for the first years, and annual for later years.
Structure of Projection
| Item | Years 1–3 (establishment) | Years 4–7 (entering bearing) | Years 8+ (full bearing) |
|---|---|---|---|
| Inflows: hazelnut sales | 0 or minimal | increasing | stable, peak |
| Inflows: subsidies/grants | yes | yes | yes |
| Inflows: loan/leasing | as needed | — | — |
| Outflows: investment (seedlings, irrigation, machinery) | high | occasional | equipment renewal |
| Outflows: maintenance (fertilization, protection, pruning, harvest) | increasing | increasing | full |
| Outflows: loan repayment/interest | yes | yes | yes |
| Net Cash Flow | negative | towards positive | positive |
The most dangerous period is the "cash trough" — the period between planting and the first significant sale. In this period, there is no revenue from fruit, while maintenance costs and repayments continue. Web sources for commercial orchards emphasize that financing must cover at least 30 months of overhead, wages, and working capital before the first significant inflow. Harvest also concentrates in September and October, so most of the inflow is once a year, while outflows flow continuously — this requires careful liquidity planning within the year itself.
Most Common Mistake
Underestimating working capital for years without revenue. Many plans precisely calculate the cost of establishing the orchard, but forget that you need to survive 3–7 years before the orchard begins to finance itself. Ensure a liquidity reserve for the entire period until positive cumulative cash flow.
Sensitivity Analysis
Sensitivity analysis is a simple but powerful method for assessing how changes in key assumptions affect profitability. As an investment study from the corpus states: "Sensitivity analysis represents a very simple method used to locate and assess possible risks that affect project profitability." Data from the income statement is used, and three scenarios are most often tested.
An example from literature (amounts in Kuna, illustrative, shows net result by project years with ±5% deviation):
| Scenario | Year I | Year II | Year III | Year IV | Year V |
|---|---|---|---|---|---|
| A — Revenue −5% | 167,107 | 60,996 | 209,576 | 232,709 | 241,972 |
| B — Costs +5% | 170,310 | 43,469 | 83,871 | 119,255 | 127,790 |
| C — Revenue −5% and Costs +5% | −3,203 | 17,497 | 125,705 | 113,454 | 114,182 |
Key message: combined unfavorable scenario (C) is the most dangerous — in the example, it pushes the first year into a deficit. The most sensitive variable in a hazelnut orchard is usually yield (because it directly multiplies revenue), followed by procurement price. Note: These sensitivity figures are from Croatian/EU data; verify the United States/Oregon equivalent for local planning.
How to Conduct Sensitivity Analysis
- Identify 3–4 key variables: yield (kg/ha), price (USD/kg), labor/harvest cost, subsidy level.
- Change each variable by ±10% (and ±5%) keeping others constant.
- Track the effect on net cash flow, profit, payback period, and internal rate of return.
- Identify break-even points: minimum yield and minimum price at which the project still covers costs.
Tornado Chart
Rank variables by the magnitude of their impact on the result — the variable that "swings" profit the most deserves the most attention in risk management and data collection.
Managing Production and Market Risks
Risk is, according to literature, "a combination of the probability of an event occurring and the consequence of that event." Risk assessment combines the probability of occurrence with the severity of consequences — often in the form of a 5×5 matrix (probability from "almost impossible/5%" to "almost certain/95%", consequences from "negligible" to "catastrophic"). The product gives the risk level and priority for action.
Main Risk Categories
| Category | Examples | Mitigation Measures |
|---|---|---|
| Climate | drought, late spring frosts, extreme temperatures, storms, hail, floods, fire | irrigation, location and variety selection, anti-frost measures, insurance |
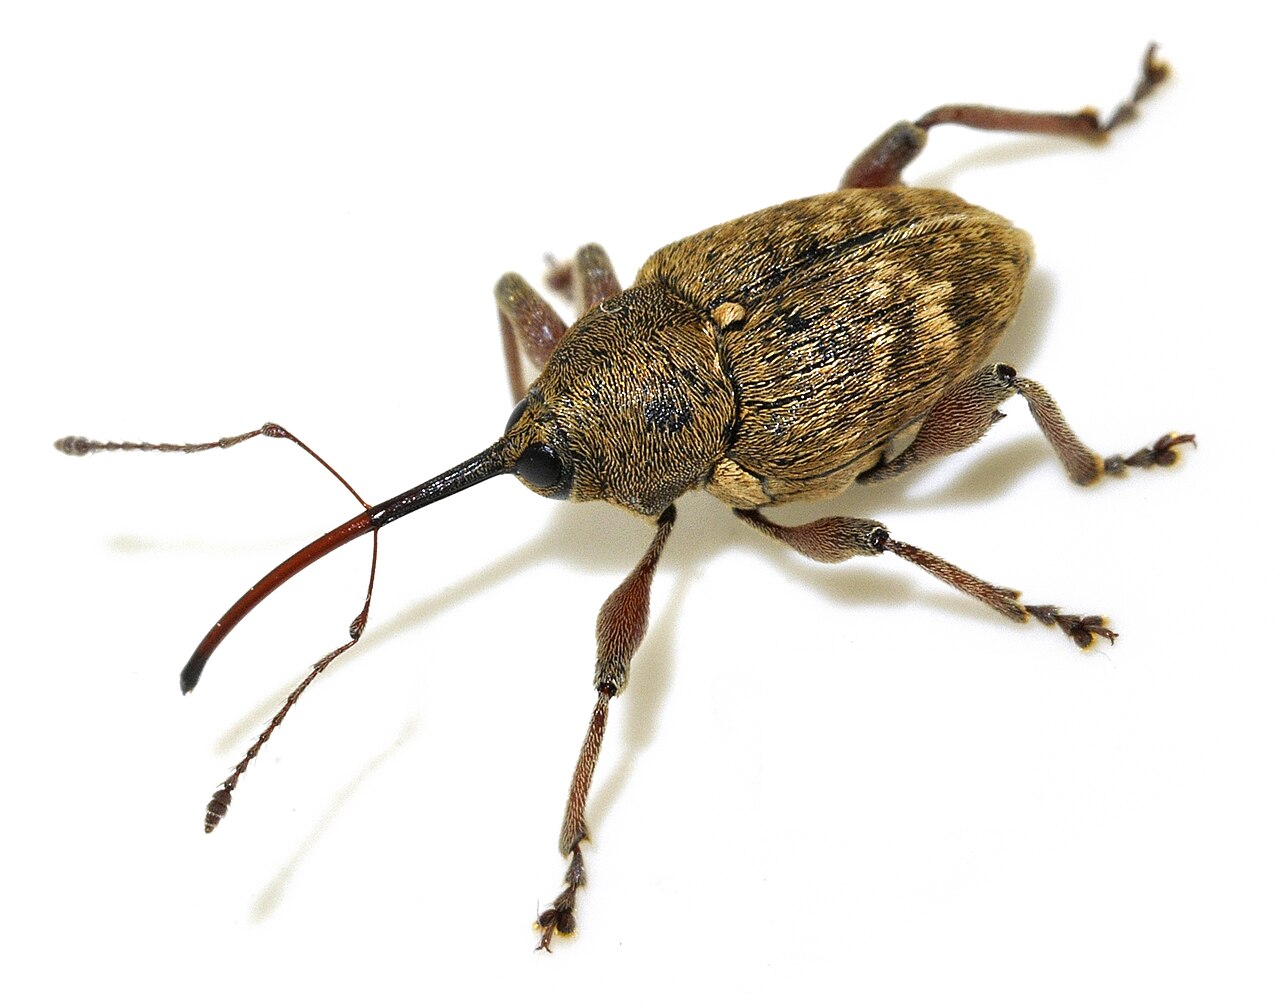
| Biological (Production) | hazelnut weevil, aphids, fungal diseases; crop damage can exceed 80% without protection | regular protection, integrated/organic production, monitoring, resistant varieties |
| Market | drop in procurement price, change in demand, dependence on one buyer | contracted procurement, buyer diversification, processing/added value, direct sales |
| Financial | interest rate rise, lack of liquidity in the "cash trough", overestimated assumptions | liquidity reserve, conservative projections, appropriate own/borrowed capital ratio |
| Regulatory | subsidy changes, planting material regulations (e.g., Rule NN 09/17), environmental protection | monitoring regulations, declared planting material, advisory service |
Insurance and Risk Transfer
Crop insurance is a key tool for risk transfer. Practice (and examples from the corpus) covers natural disasters (drought, fire, flood, earthquake), theft or damage by third parties, and pest/disease damage. In many systems, premiums are high, so state premium support is common and often crucial for policy affordability. Hazelnuts have pronounced drought resistance, but extreme conditions and fires can still reduce yield, so insurance remains advisable.
Additional measures for risk transfer and limitation:
- Legal form with limited liability — separates business from personal assets (relevant especially for direct sales and farm visits).
- Diversification — more varieties (for pollination and risk distribution), crop combination, multiple sales channels.
- Contracted procurement in advance to reduce price risk.
Climate Sensitivity of Intervention
In Croatian environmental impact assessments, orchard sensitivity to climate change is assessed by components (assets and processes in situ, inputs like water and energy, outputs/market and demand, transport routes) with ratings from 0 (not sensitive) to 3 (high sensitivity). The same approach is useful for your own risk assessment [5], [6].
Success Indicators
The business plan should show expected (un)profitability through standard indicators:
- Efficiency = total revenue / total costs (value > 1 means positive business).
- Profitability = (profit × 100) / own capital (invested).
- Payback Period — in literature 7–9 years depending on planting density [4].
- Profit Margin — in the example of a mature orchard, about 33%.
Calculate these indicators for the base, pessimistic, and optimistic scenarios from the sensitivity analysis.
Practical Recommendations and Common Mistakes
Recommendations:
- Set assumptions conservatively; consider the pessimistic scenario as the base case.
- Model cash flow monthly/quarterly for the first 3 years, then annually.
- Ensure a liquidity reserve for the entire "cash trough" period.
- Conduct sensitivity analysis for yield, price, cost, and subsidies, and find break-even points.
- Include crop insurance and check for state premium support.
- Choose declared planting material and varieties suited to the location (e.g., Roman in Slavonia) and ensure pollinators.
Common Mistakes:
- Calculating only establishment costs, ignoring working capital until first revenues.
- Optimistic yield assumptions (full bearing "from year 4") and price.
- Reliance on one buyer and lack of contracted procurement.
- Lack of reserve for unforeseen costs and climate damage.
- Ignoring seasonal concentration of inflows (harvest in September/October) in liquidity planning.
Small Pilot Orchard: How to Test the Idea Before Large Investment
All the above — conservative assumptions, cash flow projection, sensitivity analysis, and risk matrix — is best tested on a small area, before entering full investment. A pilot orchard is a consciously small, limited block (orientatively 0.5–3 ha) with which you test key assumptions of your business plan in real conditions of your plot, instead of assuming them based on others' numbers. The logic is the same as the "rule of caution for assumptions": if the project survives on small scale, it is significantly more likely to succeed at scale.
Practitioners explicitly recommend this. From the corpus, an experienced Slavonian producer (Gospodarski list / Uskoplje.info portal) advises small producers to plant hazelnuts up to 3 ha and plan for processing, because "from a price of about 2 euros per kg you cannot live, but if you go into processing, you can get at least 50 to 60 percent" on that amount. The same source warns that many "plant only for subsidies and let it grow," so the pilot also serves to learn maintenance discipline (fertilization, weeding, mandatory pruning, irrigation) before repeating it on dozens of hectares. An example from the corpus shows a typical starting size: OPG Balog started on just 1.15 ha with 600 seedlings and four varieties (Istarski duguljasti, Rimski, Crvenolisni Lambert, Tonda Gentile delle Langhe) [7].
What the Pilot Block Should Test
A pilot makes sense only if designed to answer specific, measurable questions. The most important are four groups:
| What you test | Specific Question | How you measure |
|---|---|---|
| Location | Do soil, relief, and microclimate suit hazelnuts? | Chemical soil analysis (two samples, 0–30 and 30–60 cm) before planting; monitoring late spring frosts and summer drought in valleys |
| Variety | Do selected main varieties yield and quality on your plot? | Seedling survival rate, vigor, first bearing around year 3–4 |
| Pollinators | Is pollination sufficient? | Combination of 1–2 main varieties and 2–3 pollinators (pollinators up to ~25% and within 30 m), at least three inter-fruiting varieties; monitoring percentage of fertilized fruits |
| Operations | Can you realistically perform pruning, protection, and harvest? | Actual labor hours and cost per operation vs. planned |
The last line is often the most valuable: the pilot converts assumed labor and harvest costs from sensitivity analysis into measured numbers, so you can reset the base calculation on your own, not literature, data.
How to Set Up a Pilot
- Block Structure. Larger orchards are anyway planned in blocks — an example from the corpus (Donji Hrastovac, Sunja) divides 12.2 ha of production area into four blocks of different sizes. The first block simply becomes your pilot, and others are planted only after the first assumptions are confirmed.
- Representativeness. Place the pilot on a part of the plot that faithfully represents the future orchard (same soil type, exposure, slope), otherwise results will not be transferable.
- Keep Records. Record yield by variety, phenophase dates, labor use, protection and fertilization costs, and damage from frost, drought, or pests. These data fill both the risk matrix and future cash flow projection.
- Account for Time. Hazelnuts bear first fruit only in 3–4 years, so the pilot does not give a quick answer on yield, but in the first and second years it reveals problems with seedling survival, weeds, wildlife, and labor organization.
Pilot as a Risk Filter
Agricultural production is inherently risky because it depends on weather conditions we cannot influence, and orchard establishment and maintenance costs are very high. A pilot does not eliminate these risks, but limits them to a small area and small capital — a mistake in variety or location choice on 1 ha is a much cheaper lesson than on 15 ha.
What a Pilot Does Not Solve
A pilot is not a substitute for a business plan or proper economies of scale. Some items (harvest machinery, dryer, processing line) pay off only on larger areas, so costs per kilogram in the pilot will be higher than in a mature orchard, and this should be taken into account when interpreting results. A pilot also does not cover long-term market risk — the procurement price in five years is unknown. Therefore, use the pilot for what it is strongest at: checking agronomic feasibility and local yields, while keeping market and financial assumptions conservative and developed through success indicators and sensitivity analysis.
Sources
- Upotreba GIS-a u planiranju poljoprivredne proizvodnje - uzgoj lijeske (2017)
- INVESTICIJSKA STUDIJA ZA PROIZVODNJU INOVATIVNIH PROIZVODA NA BAZI LJEŠNJAKA (Corylus avellana L.) (2019)
- Poslovni plan za proizvodnju sadnica lijeske (2019)
- Tehnolo ka i ekonomska obilje ja uzgoja 68edb878 (2018)
- Elaborat zaštite okoliša u postupku ocjene o potrebi procjene utjecaja na okoliš zahvata podizanja trajnog nasada lijeske površine oko 40 ha, Općina Vojnić (2021)
- hunt establishment site suitability PDF Podizanje trajnog nasada lijeske i 22e62a30 (2020)
- PDF EKONOMIJA I PODIZANJE NASADA LIJES c0774a45 (2021)