Return on Investment, Break-Even Point, and Long-Term Profitability
Research-grounded draft (sources cited) — adapt to local context
Article adapted to the United States (Oregon), based on Croatian/EU research literature (see Sources). Figures come from the cited studies and are indicative for the United States (Oregon): verify local equivalents with USDA, FSA, state Departments of Agriculture (e.g. Oregon), OSU Extension, Oregon Hazelnut Commission.
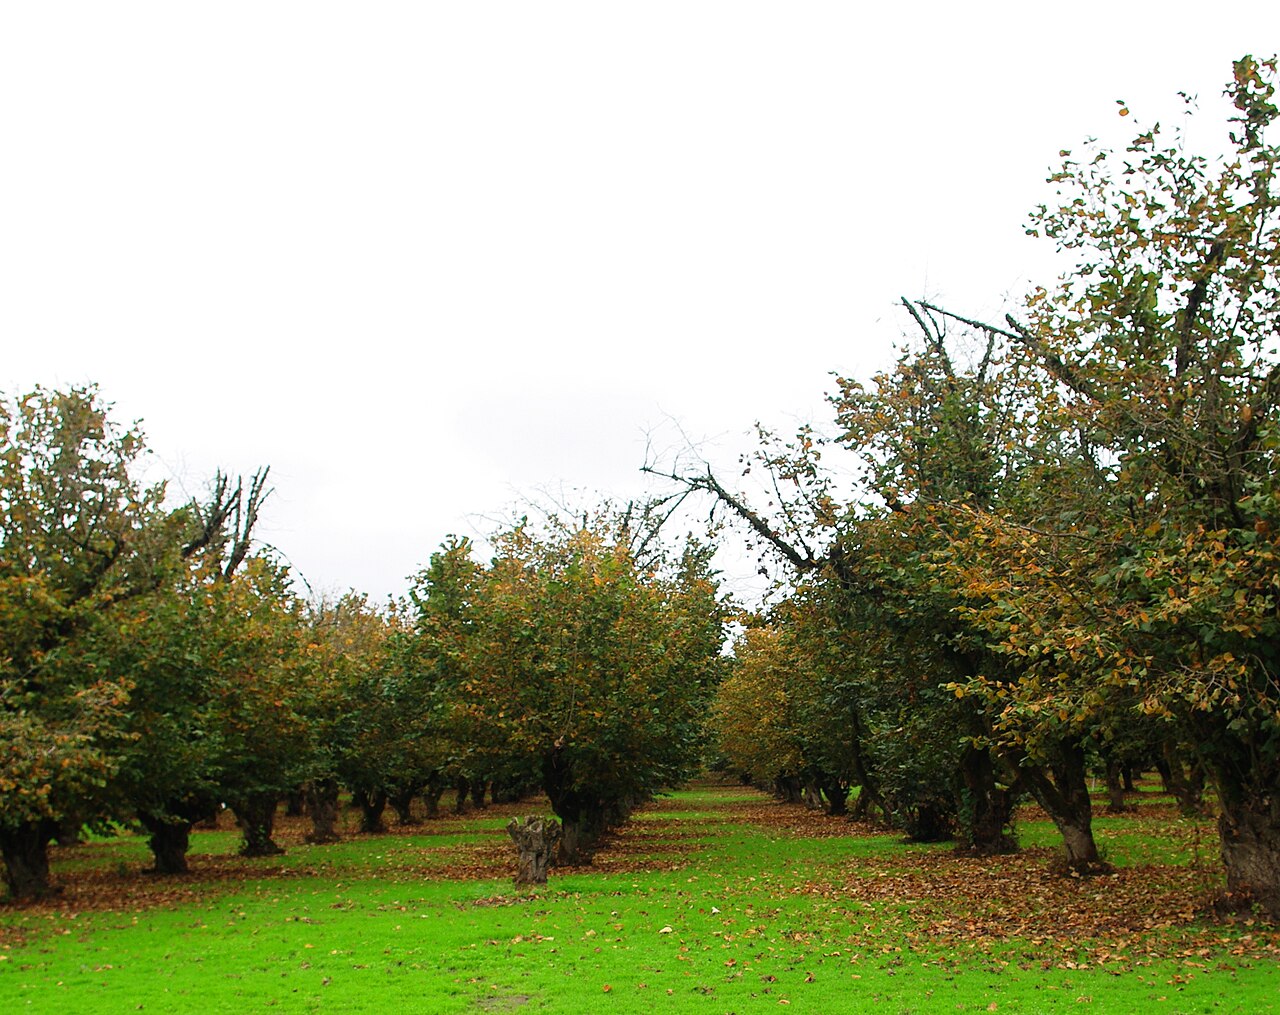
Establishing a hazelnut orchard is a capital-intensive, long-term investment: money invested in the first year begins to return only after several years, and full profitability occurs when the orchard reaches full bearing. This article explains when the orchard begins to repay the investment (payback period, break-even point), how profitability is measured by financial indicators (NPV, IRR), and how profitability changes through the phases of the orchard’s life cycle. The goal is to provide a realistic framework for decision-making—not a promise of quick profits, but a reasonable range of expectations based on Croatian and international literature and practice.
Basic Concepts: ROI, NPV, IRR, and Break-Even Point
Before the numbers, several definitions that a producer must distinguish because they measure different things.
| Indicator | What it measures | Practical interpretation for an orchard |
|---|---|---|
| Payback Period | How many years it takes for cumulative cash flow to reach zero | "When have I recovered everything I invested" |
| Break-Even Point | The level of yield/price/sales at which revenues cover costs | "How much must I produce/sell to not be at a loss" |
| ROI (Return on Investment) | Ratio of profit to invested capital (%) | "What percentage return do I get on my investment" |
| NPV (Net Present Value) | Sum of all future cash flows discounted to today | If NPV > 0, the project creates value |
| IRR (Internal Rate of Return) | Discount rate at which NPV = 0 | "Effective annual rate of return of the project" |
| Profitability (Rp) | Profit / total costs × 100 (%) | Annual profitability of the business |
| Economy (Ep) | Total revenues / total costs | If Ep > 1, the business is economical |
Key difference: Payback period answers when, break-even point answers how much, and NPV/IRR take into account the fact that money today is worth more than the same amount in ten years (discounting). For perennial crops with a long period without income, discounting is crucial—this is why a serious assessment for hazelnuts cannot be reduced to just "sum of revenues minus sum of costs."
Timeframe: From Planting to Full Bearing
Orchard profitability directly follows the yield curve, which develops slowly for hazelnuts.
| Phase | Orchard Age | What happens to yield and money |
|---|---|---|
| Establishment | Year 0 (planting) | Highest cost, no revenue |
| Early Youth | Years 1–3 | No revenue or minimal; only subsidies |
| Entry into Bearing | Years 3–4 | First fruits, revenue still symbolic |
| Increasing Yield | Years 5–6 | Yield rises, approaching break-even |
| Full Bearing | Years 7–8 onwards | Maximum yield and profit |
| Plateau of Full Bearing | ~Years 7–50 | Stable, highest profitability |
The literature is very consistent about these turning points:
- First fruits usually appear in years 3 to 4 (depending on the variety) [4].
- Full bearing occurs around year 7 (sometimes year 8) [2].
- Economic life of the tree is estimated at around 50 years (biological lifespan 70–100 years, bearing fruit for 50–70 years).
From this follows the fundamental truth of hazelnut economics: the investor operates exclusively at a loss for several years until the orchard begins to bear seriously. Croatian and Bosnian practice expresses this very directly—"the realistic calculation is that the return on investment comes after 9 to 12 years to break even," with the warning that "you can live on subsidies, but you won't get the yield" in the early years.
Payback Period of Investment
Combining sources, the following realistic range for the payback period (recovery of the entire initial investment) is obtained:
Realistic Payback Range
Practice in Croatia and BiH: ~9 to 12 years to "zero" (cumulative recovery of investment). Optimistic/projection studies: ~6 to 8 years under favorable conditions (existing equipment, high yield, good price).
Why such a difference? The payback period strongly depends on several levers:
- Does infrastructure already exist. Several analyses emphasize that the investment is "low" precisely because the investor already owns land, machinery, and some equipment. Those starting "from scratch" (buying land, tractors, pickers, dryers, fences) have a significantly longer payback.
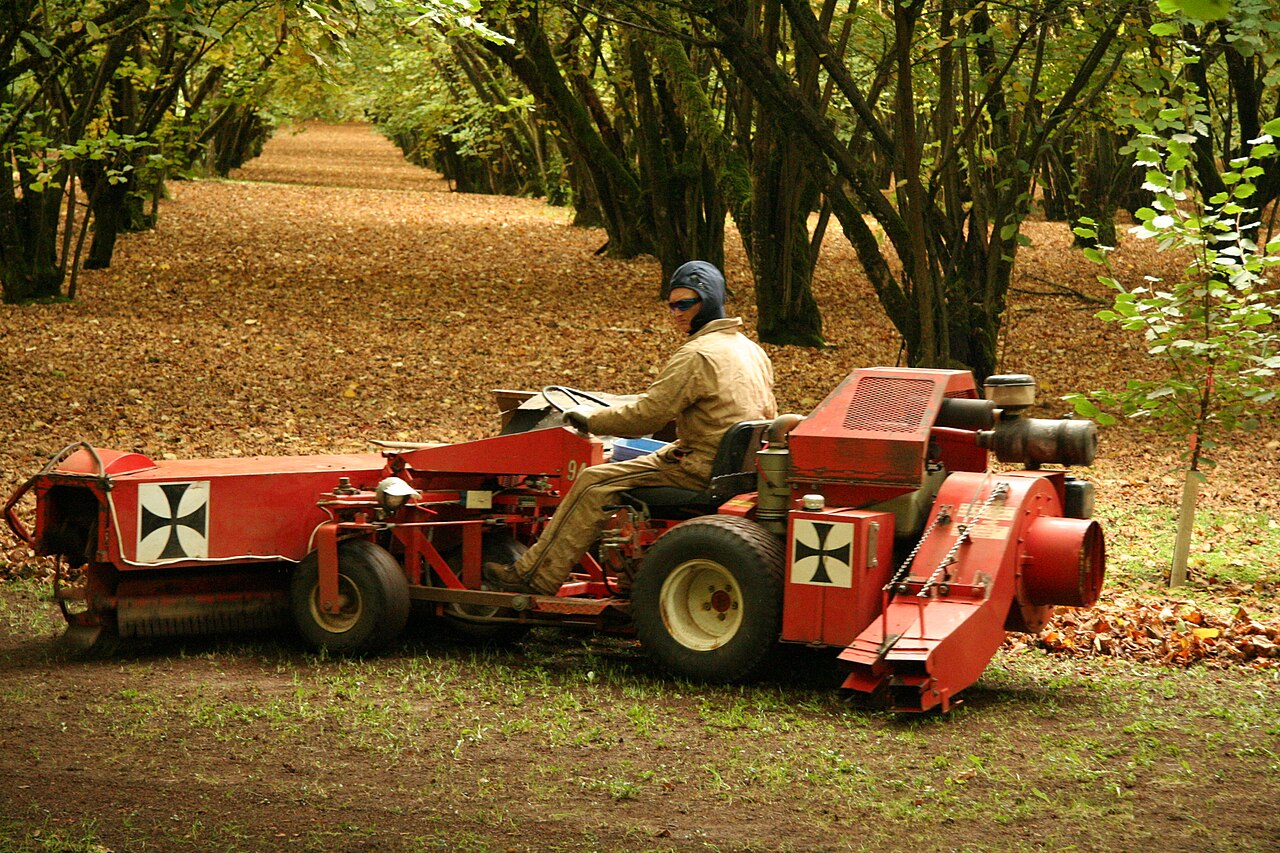
- Level of mechanization. Practice is clear: "doing everything by hand is not profitable, so mechanization is very important." Mechanization raises the initial cost but shortens the payback on larger areas.
- Subsidies. In the early, revenue-free years, subsidies are often the only inflow. According to newer reports from practice, direct supports are available (e.g., ~150 EUR/ha for any crop) and additional measures for hazelnuts (e.g., reimbursement of part of the seedling cost). The exact amount and conditions change every year—check the valid Regulation on the Implementation of Direct Support for the current year. Note: The following figures are from Croatian/EU data; verify the United States/Oregon equivalent. In 2006, there was a subsidy for establishing perennial crops amounting to 2,229 euros per hectare, which covered the establishment costs of 2,222.05 euros [2].
- Hazelnut Price. The purchase price enters directly into all indicators; historically, the price of unshelled hazelnuts has fluctuated widely, so years with low prices prolong the payback.
Example from Practice (Young Orchard)
A producer states: "It takes 8 years for hazelnuts to give full yield, so we are currently achieving only 30 percent of the full yield." This well illustrates why revenues in years 4–6 are still partial and why full payback comes later.
Break-Even Point
The break-even point for an orchard has two faces.
1. Annual (Operational) Break-Even Point — when current revenues cover current costs for that year. In the literature, the transition from minus to plus is seen by orchard age:
| Orchard Age | Financial Result (Example from Study, kn/ha) |
|---|---|
| Year 1 | −1,836 (loss) [1] |
| Year 6 | +5,301 (profit) [1] |
| Year 36 | +23,466 (high profit) [1] |
In other words, the annual result turns positive somewhere around year 5–6 as yield increases, and then continues to grow toward full bearing. Note: These figures are from Croatian/EU data; verify the United States/Oregon equivalent.
2. Covering Variable Costs (Contribution Margin) — how much of the revenue remains after covering variable costs (harvesting, protection, fertilization) to cover fixed costs and profit. Practice cites a variable cost coverage of about 6,193 kn/ha, "available to cover fixed costs and generate profit."
How to Calculate Annual Break-Even Yield Yourself
Break-Even Point (kg/ha) = Annual fixed + variable costs (kn/ha) ÷ purchase price (kn/kg). Example: if total annual costs are 60,000 kn on the orchard and the price is 10 kn/kg, you must sell 6,000 kg to cover costs. At a yield of 10 t/ha, that orchard is clearly above break-even. Numbers are illustrative—insert your actual costs and current price.
Profitability in Full Bearing: Revenues, Costs, Margin
When the orchard enters full bearing, the economics change significantly. Several representative calculations from the literature (caution: different years, prices, and currencies—serve for order of magnitude, not as a guarantee):
| Source / Scenario | Yield | Price | Annual Result |
|---|---|---|---|
| Orchard ~10 yrs, high yield | 10 t/ha | 10 kn/kg | Revenue ~100,000 kn/ha, costs ~60,000 kn → profit ~40,000 kn/ha |
| Conservative calculation | 2 t/ha | 11 kn/kg | Revenue ~22,000 kn/ha → profit slightly more than 6,000 kn/ha |
| Organic Orchard (calculation) | ~5.28 t-equivalent net | — | Net profit ~5,285 kn/ha (×15 ha = 79,272 kn) [7] |
| Organic Orchard (1 ha) | 1,200 kg shelled | 1.99 EUR/kg | FR ~864 EUR/ha; profitability 33.37 %, economy 1.33 |
Typical profitability indicators repeated in sources:
- Economy (Ep) > 1 (e.g., 1.25–1.33) — the business returns more than it spends.
- Profitability (Rp) of the order of 20–33 % in good years of full bearing.
- EBIT margin in one business plan ~20.7 %, with a note on relatively low financial risk [5].
- Return on Revenue ~19.75 % in one analysis [4].
Important: these numbers vary greatly with price and yield. The same study warns that "economic success indicators are variable from year to year, depending on climatic conditions, market, market prices, and yield levels."
Yields That Drive Profitability
Profitability stands and falls with yield. Typical ranges from the literature:
| Level | Yield (t/ha) | Comment |
|---|---|---|
| Weak / young orchard | 2.2–2.6 | Lower limit of profitability |
| Average good practice | 3.0–3.6 | "With proper agro- and pomotechnical measures" |
| Top orchards | up to 4 (and more) | In full bearing, intensive systems |
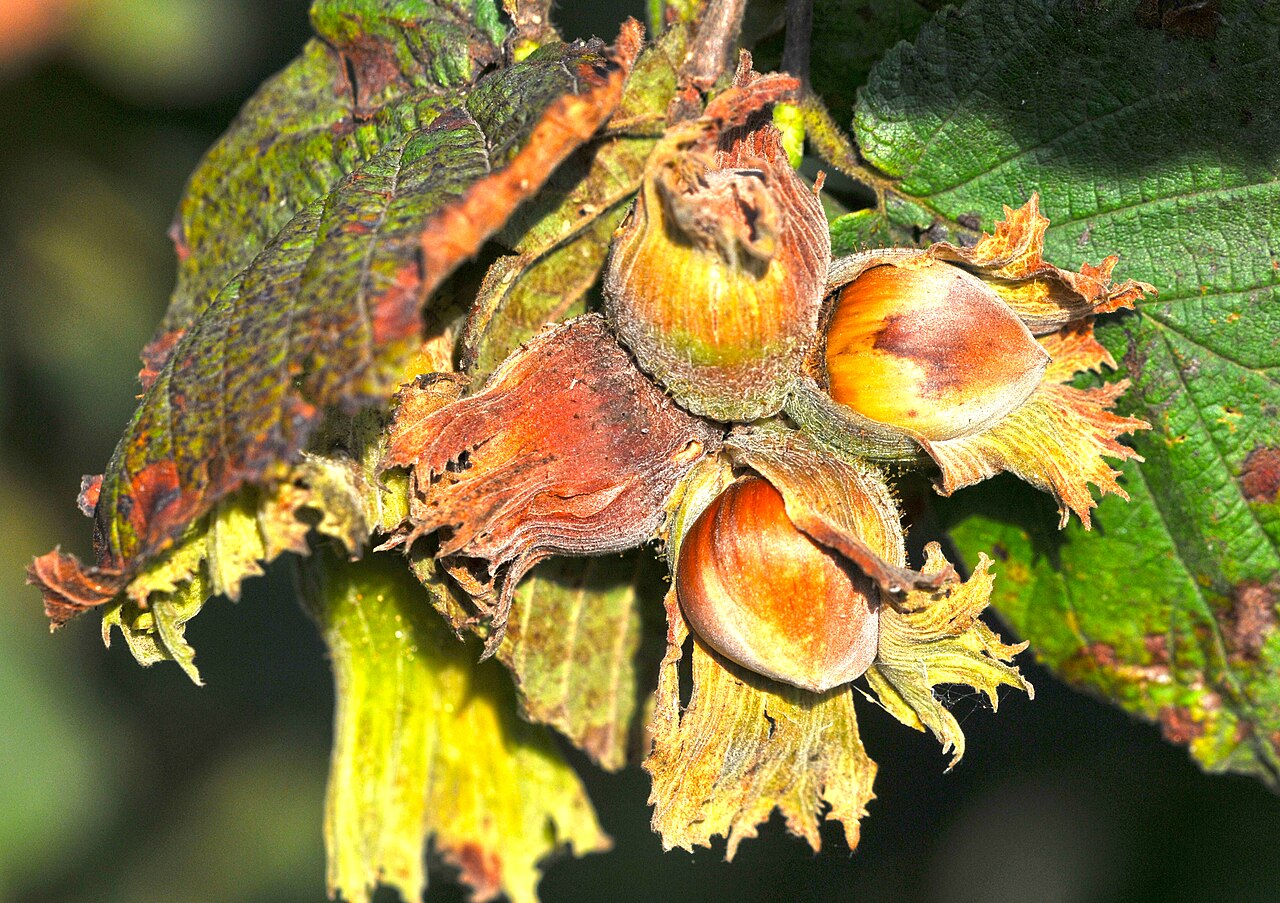
In full bearing, one tree yields approximately 5–12 kg depending on variety and training form, and a significant portion of the fruit (about 50–60 %) is shell—important when comparing prices of hazelnuts "in shell" and "shelled."
Profitability by Life Cycle Phases
Combining everything, the long-term profile of the orchard looks like this:
| Phase | Years | Cash Flow | Profitability |
|---|---|---|---|
| Investment | Years 0–3. | Strongly negative (investments, no revenue) | Loss; survival on subsidies |
| Transition | Years 4–6. | From negative to positive | Annual break-even; rising yield |
| Payback | ~Years 7–12. | Positive, recovers cumulative investment | Cumulative payback achieved |
| Plateau of Full Bearing | ~Years 7–40. | Stable high positive | Highest and most stable profit |
| Old Age | ~Years 40–50. | Positive, but declining | Yield drop; renewal planning |
Message: hazelnuts are a "long-term" investment. Only after passing the payback period (approximately the second half of the first decade to the beginning of the second) does the orchard enter a long period of stable profit that justifies the entire investment. Precisely because of the long economic life (~50 years), the NPV of the entire project can be very positive even when the payback period is long.
How to Make Your Own Assessment (NPV/IRR Step by Step)
- Estimate initial investment (Year 0): soil preparation, seedlings, planting, fencing, irrigation system, mechanization (or its share). Note: Specific costs such as 2,222.05 EUR/ha for establishment are from Croatian/EU data [2]; verify the United States/Oregon equivalent.
- Develop annual costs by year: highest in Year 1, lower in Years 2–3 (maintenance), then stable operational costs (fertilization, protection, harvesting, drying) in bearing years.
- Project revenues by yield curve: 0 to Years 3–4, then growth to full bearing in Years 7–8.
- Include subsidies for years in which you qualify them (per valid Regulation).
- Calculate annual net cash flow (revenues + subsidies − costs).
- Discount future flows at a chosen rate (e.g., loan interest rate + risk premium) and sum → NPV. If NPV > 0 at your discount rate, the project creates value.
- Find IRR as the rate at which NPV = 0 and compare it with the cost of capital (e.g., 4% annual interest from a typical HBOR loan). Note: HBOR is a Croatian bank; verify the United States/Oregon equivalent.
- Perform sensitivity analysis on hazelnut price and yield—these are the two variables that most change the outcome.
Financing
Typical model from business plans: loan (e.g., via HBOR) for ~5 years at ~4% annually, with working capital for inventory and current operations. Ensure the loan repayment period does not fall in the period before the orchard begins to generate revenue—mismatch of repayment and yield curve is a common cause of liquidity problems. Note: Specific working capital figures such as 130,000 kn for a reproduction cycle are from Croatian/EU data [6]; verify the United States/Oregon equivalent.
Practical Recommendations and Common Mistakes
Recommendations
- Plan for the long term. Plan liquidity for 7–12 years, not 2–3.
- Mechanize wisely. Manual labor does not scale; harvesting is the largest variable cost.
- Use existing resources. If you already have land and equipment, payback is significantly faster.
- Monitor subsidies every year. Conditions change; check the current Regulation.
- Diversify income through processing. Processed hazelnuts (e.g., spreads, roasted products) give a higher margin than selling raw material; small producers increase profitability this way.
- Perform sensitivity analysis on price and yield before planting.
Common Mistakes
- Expecting quick profits ("people often lose patience, expecting quick profits").
- Ignoring discounting—summing nominal amounts overestimates profitability.
- Underestimating harvesting and drying costs.
- Poorly timed loan repayment in revenue-free years.
- Calculating with peak yield from the first bearing year instead of a gradual curve.
- Ignoring market risk—agriculture is risky; price and climate vary from year to year.
Summary of Key Numbers
- First bearing: Years 3–4. Full bearing: ~Year 7 (–8).
- Annual break-even point: approximately Years 5–6 (result turns positive).
- Payback period of investment: realistically ~9–12 years (optimistically 6–8 under favorable conditions and existing equipment).
- Profitability in full bearing: profitability of the order of 20–33 %, economy > 1.
- Economic life of the orchard: ~50 years of stable bearing after payback.
All numbers are informative and depend on variety, location, price, yield, and valid subsidies—before investing, make your own calculation and verify it with an agronomic and financial advisory service.
Sources
- Tehnološka i ekonomska obilježja uzgoja lijeske (2018)
- Ekonomska analiza proizvodnje lješnjaka (2023)
- INVESTICIJSKA STUDIJA ZA PROIZVODNJU INOVATIVNIH PROIZVODA NA BAZI LJEŠNJAKA (Corylus avellana L.) (2019)
- Ekonomska isplativost proizvodnje lješnjaka (2022)
- Poslovni plan za proizvodnju sadnica lijeske (2019)
- REPUBLIKA HRVATSKA Poljinos 27fd210a 2 (2019)
- gap harvest PDF Ekonomska isplativost proizvodnje 88521013 (2022)