Foliar Analysis and Nutritional Diagnosis
Content generated by artificial intelligence — verify before application
This article was automatically compiled from a collection of hazelnut literature using artificial intelligence and may contain errors or outdated information. It serves as a starting point for further research, not as professional advice. Dosages, products, and timing are informative and depend on the cultivar, location, and current regulations — always consult an advisory service and official sources before application.
Foliar (leaf) analysis is the most reliable tool for assessing the actual nutritional status of a hazelnut orchard. While soil analysis shows how much nutrient is available in the soil, leaf analysis shows how much nutrient the plant has actually absorbed and incorporated into its tissue. Therefore, these two approaches complement each other: soil analysis reveals the reserve and pH, while leaf analysis reveals whether that reserve has actually reached the leaves and fruit. In intensive orchards, where the goal is high and stable yield, leaf analysis becomes the foundation for precise, "tailored" fertilization rather than "blind" fertilization. This article explains how to properly collect leaf samples, what the reference (optimal) values for elements are, and how to interpret results to precisely correct the fertilization program.
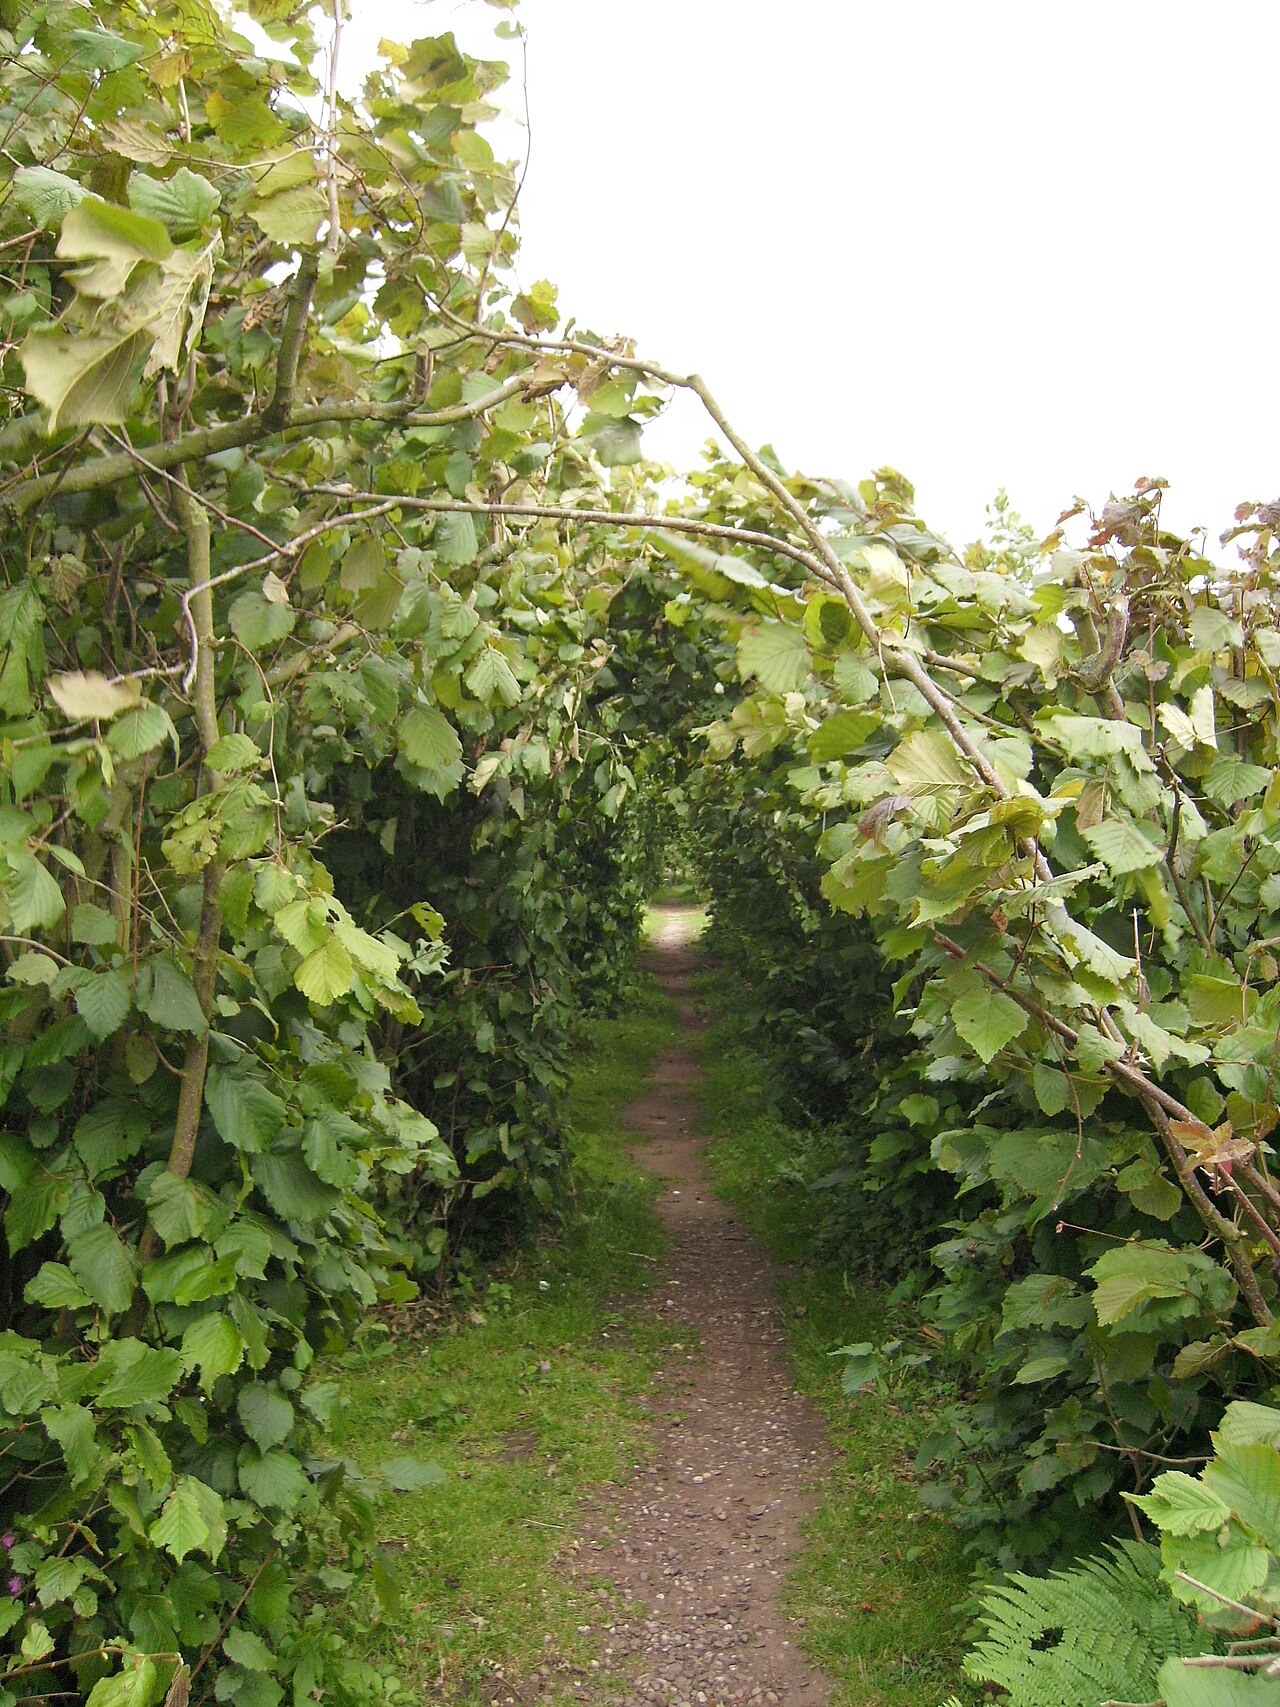
Why leaf analysis, and not just visual inspection
Deficiencies of certain nutrients can be partially recognized through visual inspection (chlorosis, necrosis, deformities), but such symptoms appear only when the deficiency has already progressed and yield has already been reduced. Leaf analysis detects so-called hidden (latent) deficiency — a condition where the tree looks healthy from the outside, but the concentration of a certain element is already below optimum, causing yield and fruit quality to quietly decline.
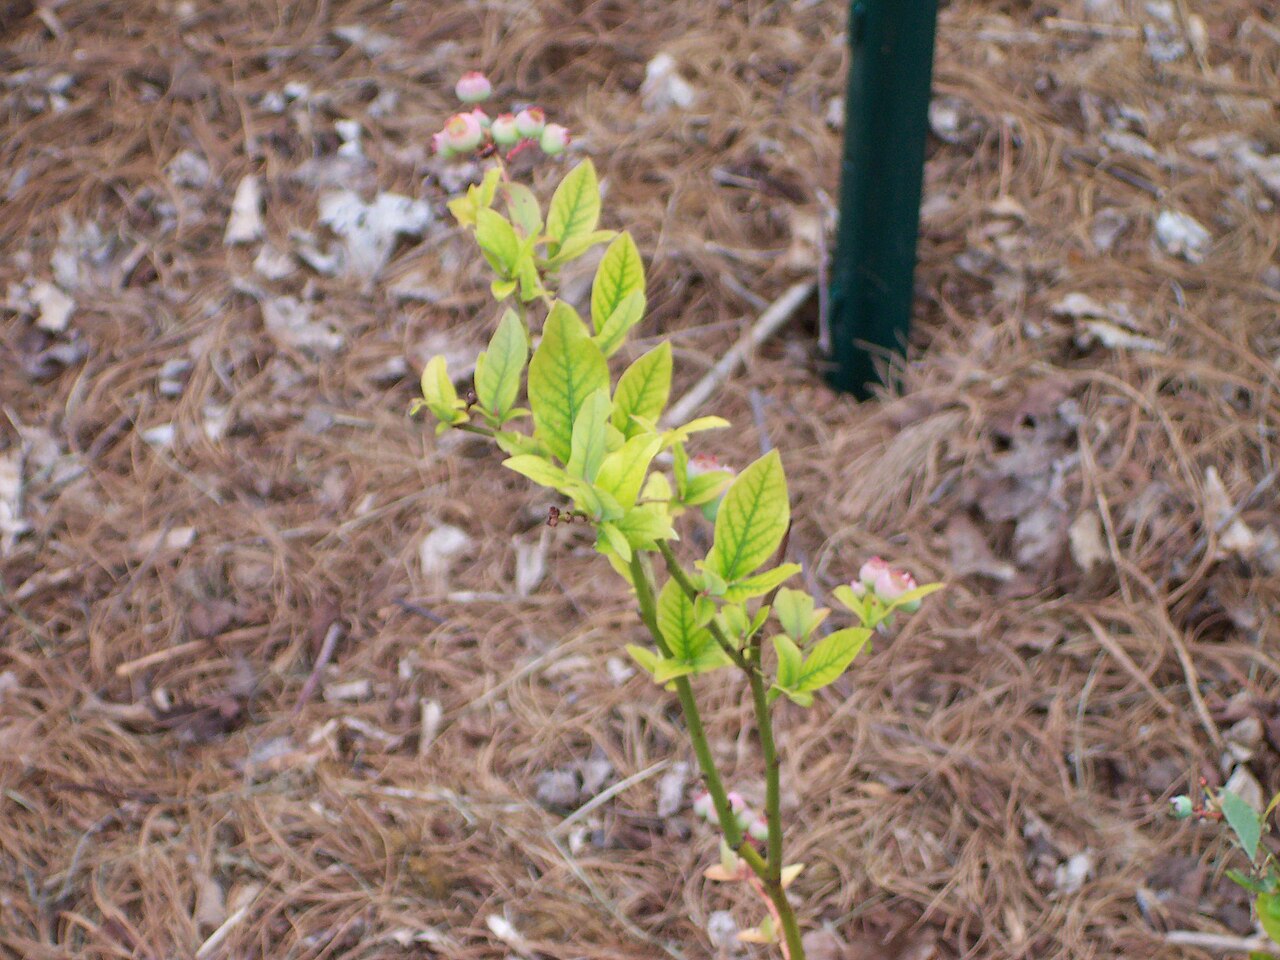
According to the corpus literature, in larger intensive orchards, it is recommended to perform foliar leaf analysis and apply fertilizers precisely based on the results, because leaf analysis provides a "much more precise answer" than visual inspection. Leaf analysis additionally allows for:
- development and adjustment of the fertilization program over the years;
- assessment of the amount of nutrients removed from the orchard by the fruit (for replenishment);
- confirmation of the diagnosis based on symptoms;
- directing further tests when the cause of poor growth is unclear.
Rule out other causes first
Before attributing poor growth to nutrient deficiency, rule out other possible causes: lack of pruning, winter injuries, poor drainage or shallow soil, physical injuries, diseases and pests, poor pollination, rodents, and lack or excess of water. Leaf analysis makes sense only when these factors have been reasonably ruled out.
Leaf Sampling
The quality of results depends primarily on correct sampling. Even the best laboratory will provide a worthless result if the sample is poorly collected. Standardization of the procedure (timing, leaf position, number of leaves) is key to ensuring the result can be compared with reference values and tracked over the years.
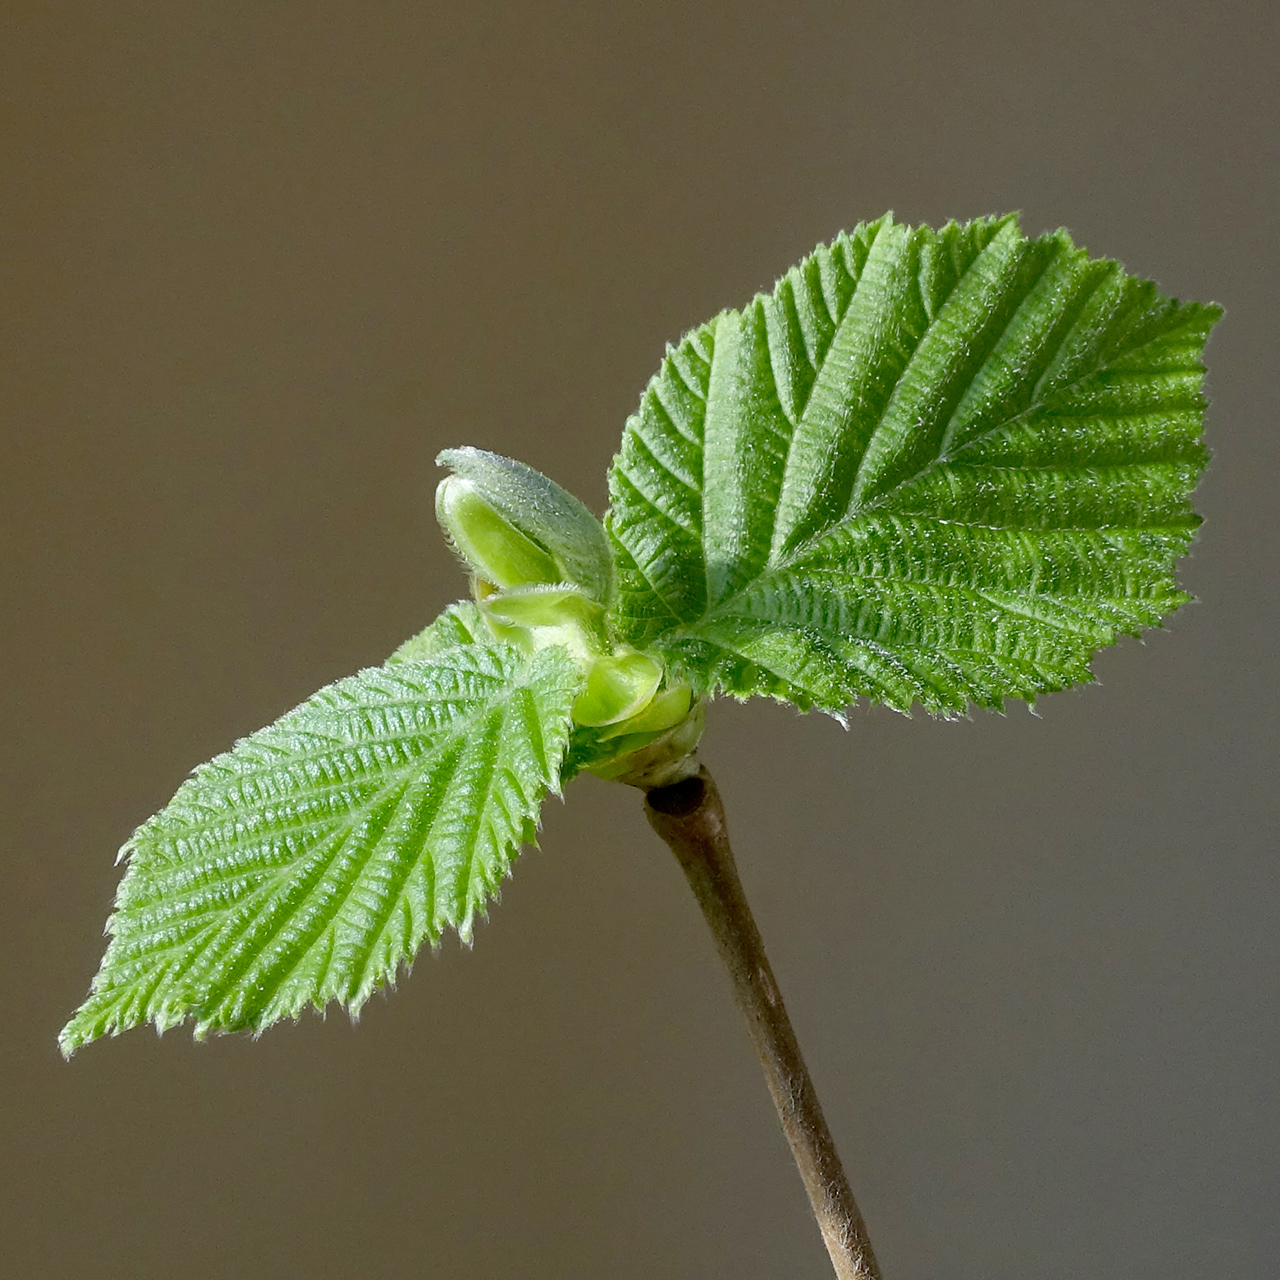
Sampling Timing
Sampling timing is crucial because element concentrations in the leaf change throughout the season. Nitrogen is highest in spring (April) and then declines, while some elements (e.g., potassium) have their own dynamics. For results to be comparable with reference values, the sample is taken during a period when the concentration in the leaf is relatively stable.
| Source / Region | Recommended Sampling Period |
|---|---|
| Oregon (OSU) and British Columbia | August (before harvest) |
| Northern Italy (hazelnut) | June – August (least fluctuation in values) |
| Turkey (research on hazelnut) | June – September, optimum June – August |
| General rule for fruit trees | June – August, when leaves are fully developed |
Periods are informative and depend on climate, cultivar, and location. It is key to sample in the same period and phenological phase year after year so that results are comparable.
Which Leaves to Pick and How Many
- Select fully developed, recently matured leaves from the middle part of the current (this year's) shoot — not the youngest apical or oldest basal leaves.
- Take leaves from the outer part of the canopy, roughly at head height, from the middle of the canopy, from non-fruiting (vegetative) shoots.
- Typically, about 50 leaves are taken from at least 10 representative trees within a homogeneous parcel (e.g., up to ~4 ha / 10 acres). When sampling from an individual tree, take at least 5 leaves and maintain an equal number of leaves per tree.
- Depending on the laboratory protocol, the petiole (leaf stalk) is included in the sample — follow your laboratory's instructions.
Rules for a Representative Sample
- Sample different sections of the orchard separately: different cultivars, different soils, young and bearing orchards, visibly weaker areas should be sampled separately from healthy ones (for diagnostic purposes of the "problematic zone").
- Avoid contaminated leaves: dusty leaves, leaves sprayed with fertilizers/pesticides, leaves damaged by insects or with traces of droppings.
- After foliar feeding or spraying, wait at least ~15 days before sampling; otherwise, spray residue on the leaf will falsely elevate measured values.
- Do not sample under "abnormal" conditions (severe drought, immediately after heavy rains), as these temporarily distort uptake.
- Store leaves in paper bags (not plastic — condensation and mold), label them, keep them cool, and send them to the laboratory as soon as possible (ideally within 24 hours).
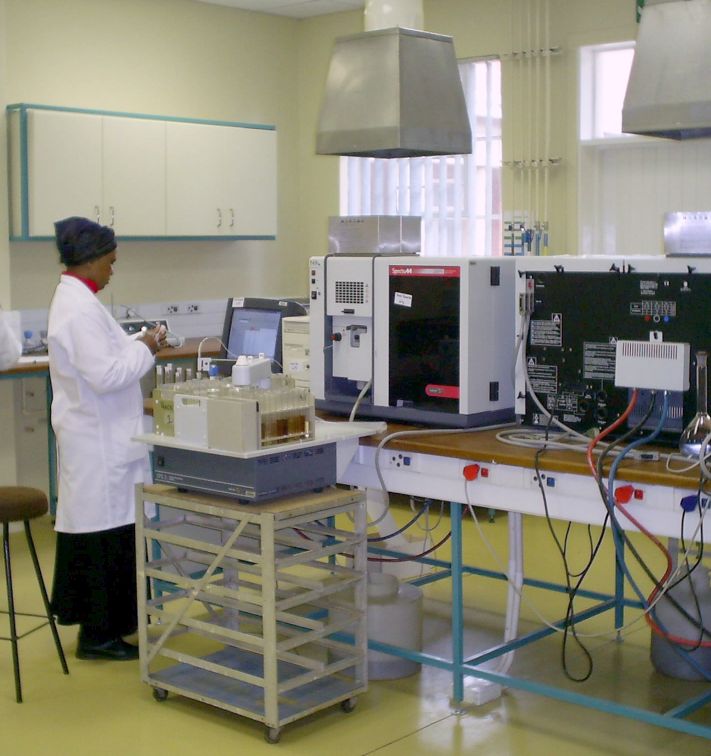
- Use an accredited laboratory that applies recognized methods for leaf tissue analysis (e.g., participation in quality control programs like NAPT), so that results are reliable and comparable.
Reference (Optimal) Values of Elements in Hazelnut Leaves
The core of interpretation is comparing measured concentrations with reference values — critical limits and optimal (sufficient) ranges. Values are expressed on dry leaf matter: macroelements in %, and microelements in ppm (mg/kg).
Main Reference Table (on dry leaf matter)
The following table from the corpus is based on the Hazelnut Nutrient Management Guide (2021) and represents a practical framework for interpreting results:
| Element | Symbol | Deficiency Limit | Optimal Leaf Concentration |
|---|---|---|---|
| Macroelements | (% on dry matter) | (% on dry matter) | |
| Nitrogen | N | < 1.80 | 2.21 – 2.50 |
| Phosphorus | P | < 0.10 | 0.14 – 0.45 |
| Potassium | K | < 0.50 | 0.81 – 2.00 |
| Sulfur | S | < 0.08 | 0.13 – 0.20 |
| Calcium | Ca | < 0.60 | 1.01 – 2.50 |
| Magnesium | Mg | < 0.18 | 0.25 – 0.50 |
| Microelements | (ppm on dry matter) | (ppm on dry matter) | |
| Manganese | Mn | < 20 | 25 – 250 |
| Iron | Fe | < 40 | 51 – 400 |
| Copper | Cu | < 2 | 5 – 15 |
| Zinc | Zn | < 10 | 16 – 60 |
| Boron | B | < 25 | 31 – 75 |
Source: Hazelnut Nutrient Management Guide (2021.), via RAG corpus. Values are informative and may vary depending on cultivar, sampling time, method, and source of reference norms.
Nitrogen Comparison According to OSU (Oregon)
For nitrogen, the most important element for fruit growth, research from the University of Oregon (OSU) develops ranges for August leaf samples:
| Status | N in Leaf (August, % dry matter) |
|---|---|
| Optimal | 2.2 – 2.5 |
| Deficiency | 1.8 – 2.2 |
| Severe Deficiency | < 1.8 |
Boron — Watch the Upper Limit
Boron is specific because the range between deficiency and excess is very narrow. According to OSU/BC sources:
- The optimal range in the leaf is approximately 31 – 75 ppm (according to the table above).
- At leaf B above ~200 ppm, phytotoxicity (speckled "burning" of the leaf) has been observed; in this case, it is recommended to omit boron application the following year.
Boron: easy to move from deficiency to excess
Apply boron foliarly with caution and targeted, based on leaf analysis, because the difference between sufficient and toxic levels is small. Do not apply boron "preventively" without data on the orchard's status.
What Field Results Say (Ranges in Practice)
The corpus also indicates that actual measured values in orchards often vary around the optimum, which confirms the importance of individual analysis:
| Element | Example Measured Value (Field Data, Turkey) |
|---|---|
| N | 1.91 – 2.33 % |
| P | 0.12 – 0.25 % (average ~0.24 %) |
| K | 0.77 – 0.87 % |
| Ca | 1.52 – 1.96 % |
| Mg | ~0.42 % |
| Zn | ~21 mg/kg |
In one Turkish study, it was found that ~94% of samples had "sufficient" and ~6% had "low" phosphorus content — a good example of how deficiency often occurs only in part of the orchard, which is visible only through analysis.
Interpreting Results and Translating to Fertilization
A result in itself is not a recommendation — only interpretation within context drives action. Categorize each element and only then plan the intervention.
Step-by-step
- Categorize each element: below the deficiency threshold → deficiency; within the optimal range → sufficient; above the upper limit → excess/toxicity risk (especially B, Mn, Cu).
- Link with soil analysis and pH: hazelnut has a shallow root system and is sensitive to pH. At pH < 6.0, uptake is hindered (e.g., P, Mo, Ca), and at pH > 7.2, micronutrient blockage occurs (Fe, Zn, Mn — so-called induced chlorosis) even if they are present in sufficient quantities in the soil. In such cases, the problem is not the amount of nutrients but their availability.
- Distinguish the cause of deficiency: is the element absent from the soil, or is it present but unavailable (due to pH, drought, antagonisms)? The solution depends on this — soil/pH amelioration versus rapid foliar feeding.
- Decide on the application method: chronic deficiencies and macronutrients → correction through the soil (base/ameliorative fertilization); acute deficiencies, micronutrients, and stressful situations (drought, leaching after rains) → foliar feeding, which acts quickly.
- Monitor trends over years: a single result is a snapshot; a value only gains meaning through a series of results from the same plot showing a direction of change.
Typical Scenarios and Direction of Solution
| Leaf Result | Possible Cause | Direction of Solution (Informative) |
|---|---|---|
| Low N, dry summer | Poor N uptake due to lack of soil water | Foliar N during summer; irrigation |
| Low N after heavy rains | Leaching of nitrate N from soil | Foliar N supplementation |
| Low Fe/Zn/Mn with high pH | Induced blockage on calcareous soil | Foliar chelates/micronutrients; long-term pH correction |
| Low K | Poor K supply, antagonism with Mg/Ca | K correction through soil; foliar application during fruit development |
| High B (> 200 ppm) | Excessive boron application | Omit B in the next season |
Linking with the Foliar Program
Leaf analysis fits best into a foliar program tied to phenological phases. According to the corpus, in orchards in good condition and fertile soil, 2 – 4 foliar treatments through the vegetation period are sufficient, while in poorer conditions (acidic or sandy soils, low fertility, pronounced micronutrient deficiencies, high lime content) the number can rise to 6 – 8 treatments. In the early stage (March/April — pollination, bud swelling), the focus is on biostimulants and micronutrients (Zn, B, Fe, Mo), while in summer the focus is on nitrogen supplementation and elements important for fruit set. The solution is usually prepared with approximately 300 – 500 L of water/ha, with a target spray pH of around 6.5.
Doses are informative
All mentioned doses, concentrations, timing, and number of treatments are informative and depend on the cultivar, location, soil condition, as well as approvals and label instructions for the product. Before application, perform a compatibility test when mixing multiple products and, if necessary, seek advice from an advisory service.
Practical Recommendations and Common Mistakes
Recommendations
- Sample every year in the same period and from the same positions in the canopy — comparability is more valuable than a one-time "perfect" analysis.
- Maintain records of results, fertilization, and yield per plot; trends over several years reveal more than a single result.
- Combine leaf analysis with soil analysis and pH data — without this, you cannot distinguish between a deficiency in the soil and uptake blockage.
- Sample problematic zones separately from healthy ones to localize the cause.
Common Mistakes
- Sampling at the wrong time of the season or at different times each year (results become incomparable).
- Picking dusty or sprayed leaves, or sampling too early after foliar feeding (falsely high values, especially Cu, Zn, B).
- Mixing healthy and diseased parts of the orchard into the same sample (averaging masks the problem).
- Interpreting results without pH and soil analysis — e.g., adding iron to soil on a basic substrate, where it will remain unavailable.
- Preventive application of boron without test results — risk of crossing into toxicity.
- Storing the sample in a plastic bag and sending it late (moisture, mold, tissue decay).
Gallery
Sources
This text is an AI summary generated from an internal collection of hazelnut literature (RAG corpus) and supplemented with publicly available sources for currency and data verification. Main sources used:
- Foliar fertilization of hazelnut for higher and better quality yield — reference table of optimal macro- and micronutrients in leaves (according to Hazelnut Nutrient Management Guide, 2021.) — RAG corpus.
- Gluhić, D.: Guide to Foliar Fertilization of Hazelnut (2021.) — gnojidba.info
- Hazelnut growers' handbook (NSW DPI) — soil and leaf analysis, comparison with optimal levels — RAG corpus.
- Özkutlu et al.: Determination of Zinc (Zn) and Other Element Nutrition Status of Hazelnut with Leaf Analysis (Ordu Univ., 2018.) — field ranges for N, P, K, Ca, Mg, Zn — RAG corpus.
- Research on seasonal dynamics of boron and leaf sampling periods in hazelnut (Turkey) — doi.org/10.32388/m2j5ez — RAG corpus.
- Tröst Lesić, K. et al.: Hazelnut Assortment / Revitalization of Vrsar Amarets (2023.) — methodology for leaf and fruit sampling — RAG corpus.
- OSU Extension: Growing Hazelnuts in the Pacific Northwest: Orchard Nutrition (EM 9080) — extension.oregonstate.edu
- Province of British Columbia: Hazelnut tree nutrient management — www2.gov.bc.ca
- WSU Tree Fruit: Leaf Tissue Analysis (sampling methodology, number of leaves, timing) — treefruit.wsu.edu
- Leaf analysis as a tool for evaluating nutritional status of hazelnut orchards in central Italy — ResearchGate
Recommended equipment
🔎 fruit tree fertilizer — Amazon →Affiliate links — we may earn a small commission at no extra cost to you.